Proppant demand outlook for Bakken, Permian
US and Canadian shale operators have adjusted completion designs and increased proppant volumes to maximize well productivity. McKinsey Energy Insights (MEI) expects this trend will continue at $50/bbl oil, particularly in the Permian basin.
MEI's analysis indicates proppant intensity-measured in lb/lateral ft (lb/ft)-in the Permian can rise up to 35% before maximizing net present value (NPV). Operators add proppant, boosting the well's initial production-and as a result its estimated ultimate recovery to increase NPV, but at a certain volume the cost of pumping additional sand down the well outweighs the benefits.
The overall increase in North American proppant demand-110 million tons in 2018 compared with 45 million tons in 2016-will benefit proppant suppliers and drive low-cost sand flooding across shale plays.
Operators have increased oil production despite the ongoing price downturn's length and severity. Exploration and production companies have increased production using two primary methods: drilling only top-tier acreage and introducing more aggressive completion designs for new wells.
Fig. 1 shows average proppant intensity in North America grew by 60% in the last 3 years.
Productivity is up 15%/year, to an average 30-day initial production (IP) rate of 3,800 bbl/1,000 lateral ft. Using these IP increases, MEI calculates the Bakken and Permian shale basins can sustain a 10% and 35% increase in proppant-loading intensity, respectively, at $50/bbl oil before reaching the point where loading stops increasing economic benefit.
Proppant intensity increased by 17%/year during 2014-16 as the number of well completions decreased by 26% during that time.
Each basin's relationship between proppant intensity and IP is different. Each basin has a point at which maximum NPV is reached and pumping additional sand into a well no longer increases economic value. But identifying this point is not straightforward.
MEI analyzed optimal points for the Bakken formation and the Permian basin's Delaware-Wolfcamp by examining increasing proppant intensity's effect on NPV.
Bakken proppant intensity
The Bakken was one of the first shale plays in which operators applied extensive unconventional drilling techniques. That history provides years of data to help producers determine optimal lateral lengths and proppant-loading intensities.
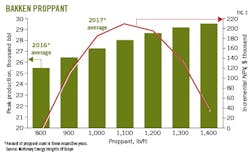
Completion data from first-half 2017 indicate relatively unchanged lateral lengths during the past year, yet operators continue to increase proppant intensities. Average loading increased to nearly 1,000 lb/ft as of June 2017 from about 800 lb/ft in 2016.
MEI's sensitivity analysis on proppant intensity shows Bakken operators have only limited growth potential from current intensity levels before the incremental pound of proppant hinders NPV.
Fig. 2 shows the Bakken's proppant intensity only 9% below a projected NPV-optimal level of 1,100 lb/ft.
Bakken producers might reach this point in mid-2018 based on historical trends, with higher-proppant intensities diminishing well values. Proppant demand will then likely stabilize barring major technological changes.
Permian proppant intensity
The Permian basin contrasts with the Bakken in how unconventional plays evolve. Characterized by strong growth and low breakeven prices, the Permian has experienced rapid well-design changes while operators test growing proppant volumes in the Midland and Delaware subplays.
Proppant volume per well has more than doubled since 2014 when operators began using low-cost local sand for fine-grain completions. Despite rapid proppant-intensity growth, the Permian does not appear to be near its optimal loading potential.
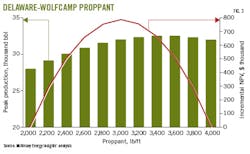
The Delaware-Wolfcamp sub-play has an average proppant intensity of nearly 2,000 lb/ft. It could realize up to a 35% increase in proppant intensity before approaching its optimal NPV. Fig. 3 shows optimal Permian proppant intensity is almost triple that of the Bakken.
Delaware-Wolfcamp wells are expected to reach NPV maximum at 3,000 lb/ft proppant intensity by early 2019 based on the historical trend in loading. That is up from 2,200 lb/ft during mid-2017.
The current trend toward greater proppant loading has resulted in sand suppliers announcing a surge of in-basin supply, with more than 40 million ton/year of announced local sand capacity compared with 3 million tons/year originally.
Initially, it appears such an increase would cause chronic oversupply.
MEI, however, expects Permian proppant demand will increase to 38 million tons in 2018 from 13 million tons in 2016. Analysts expect 70% utilization of this cheaper in-basin Permian supply.
If the proppant price were to increase 50%, optimal loading to achieve maximum NPV would only decrease by about 200 lb/ft.
Proppant is a significant cost item, but analysis shows that expected return from pumping outweighs costs even when operators account for associated service costs of transport and pressure pumping.
Productivity gains achieved by increased proppant intensity in the Permian will vary based on a particular acreage's position because geology differs across the basin.
Additional proppant demand will require new supply sources and additional logistical capacity. Supply issues are likely to emerge, but proppant supply and demand are generally expected to match without significant proppant cost increases.
Transportation logistics and pressure-pumping capacity could create headwinds for the proppant market. Difficulties include finding enough truck drivers. Proppant transportation issues tend to center around last-mile logistics because trucks move proppant from a rail station to the wellhead.West Texas road infrastructure has become progressively more congested, with several million pounds of sand delivered to each well.
Similar issues confront companies providing completions services. Accelerated drilling in the past year has stretched availability of fracturing crews. Rising sand volume for each completion exacerbates the problem as does the additional time it takes to pump larger volumes.
Both service companies and producers are attempting to address these issues, but it is too early to tell how they will affect increased proppant loading and overall demand.
Shale oil demand
Growing proppant demand in shale plays affects both the North American proppant market and the world oil market, increased unconventional oil production adds to already ample global oil supplies.
The need to pump more proppant might put continued upward pricing pressure on completion-related services, which have already seen 20-30% increases over the past 12 months.
Proppant price increases will change NPV regarding expected return on investment but will not change proppant-loading levels. In short, higher prices will reduce total return but will not change what operators need to do to make that return.
Resulting production gains and increases in well NPV will outstrip any cost increases based on increased proppant use, keeping shale oil production profitable at $50/bbl.
MEI calculated incremental NPV of a well across proppant loading intensities assuming $50/bbl oil, basing average lateral lengths per basin on mid-2017 values. Costs associated with increased proppant use, such as pressure pumping and water management, increased as a function of increasing proppant volumes.
MEI kept proppant cost per ton in each basin constant at the mid-2017 basin average across examined completion intensities. MEI determined IP rates as a function of proppant intensity using historical completions data.
About the Author
Paula Dittrick
Senior Staff Writer
Paula Dittrick has covered oil and gas from Houston for more than 20 years. Starting in May 2007, she developed a health, safety, and environment beat for Oil & Gas Journal. Dittrick is familiar with the industry’s financial aspects. She also monitors issues associated with carbon sequestration and renewable energy.
Dittrick joined OGJ in February 2001. Previously, she worked for Dow Jones and United Press International. She began writing about oil and gas as UPI’s West Texas bureau chief during the 1980s. She earned a Bachelor’s of Science degree in journalism from the University of Nebraska in 1974.


