US oil, gas producers post 1Q net loss on weak commodity prices
Conglin Xu
Senior Editor-Economics
Laura Bell
Statistics Editor
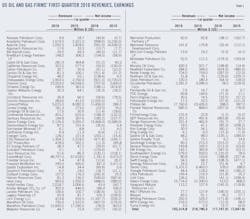
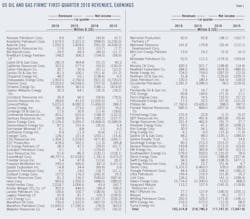
A sample of 90 US-based oil and gas producers and refiners posted a combined net loss of $17.74 billion for this year's first quarter compared with a combined net loss of $7.05 billion for the same period in 2015. The group's collective revenues for the first 3 months ended Mar. 31 were $153.31 billion compared with revenues of $216.79 billion for first-quarter 2015.
Crude oil prices during this year's first quarter averaged the lowest level since 2004, significantly reducing operating cash flow and earnings for oil and gas companies. To adapt to the low-price environment, oil and gas firms continued to reduce operating costs and increase selectivity of capital expenditures.
According to analysis from the US Energy Information Administration, first-quarter financial results from US onshore producers reveal an improving balance between capital expenditure and operating cash flow. Although operating cash flow was the lowest in any quarter in the past 5 years, larger reductions to capital expenditure brought these companies closest to self-finance, when capital investment can be paid entirely from operating cash flow.
US refiners' earnings for the first quarter, meanwhile, were down sharply from a year earlier because of lower refining margins.
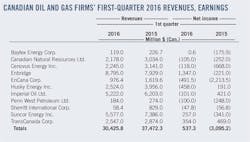
A sample of 11 oil and gas producers and pipeline companies with headquarters in Canada posted combined net earnings of $537 million (Can.) for this year's first quarter compared with a combined net loss of $3.09 billion in the same quarter in 2015. The improvement in earnings was primarily attributable to foreign exchange gains associated with a weaker Canadian dollar, less severe asset impairments relative to a year ago, and solid performance of pipeline companies. The group reported revenues of $30.42 billion for the 2016 first quarter, compared to revenues of $37.47 billion for the 2015 first quarter.
The Canadian group excludes Canadian Oil Sands Ltd. because of its acquisition by Suncor Energy Inc. on Feb. 5.
Market review
Brent crude oil prices averaged $33.84/bbl and West Texas Intermediate averaged $33.35/bbl in this year's first quarter, down from $53.97/bbl and $48.48/bbl, respectively, in the same quarter in 2015. Front-month natural gas on the New York Mercantile Exchange averaged $1.99/MMbtu in this year's first quarter vs. $2.81/MMbtu a year earlier.
US crude oil production of 9.16 million b/d for this year's first quarter was down from 9.48 million b/d a year ago, according to EIA data. US natural gas production totaled 7.21 bcf for the first quarter vs. 7 bcf for first-quarter 2015.
During the quarter, the number of US active rigs dropped to 450 from 698, according to data from Baker Hughes Inc. Rigs drilling for oil declined by 174 to 362 at the end of the first quarter, while the number of gas rigs shrank by 74 to 88 rigs drilling.
Refining profitability, which tends to be seasonally weak in the first quarter, was negatively impacted by reduced fuel margins, especially distillate margins, given high refining industry production levels and a warm winter, narrower WTI discounts relative to the Brent benchmark, and higher costs for renewable identification number (RIN) credits to meet the Renewable Fuel Standard (RFS). Continued growth in North American gas supply partly offset these factors.
According to Muse, Stancil & Co., cash margins in this year's first quarter averaged $7.84/bbl for Midwest refiners, $12.38/bbl for West Coast refiners, $10.12/bbl for Gulf Coast refiners, and $1.99/bbl for East Coast refiners. In the same quarter of the prior year, these refining margins were $16.78/bbl, $20.59/bbl, $12.11/bbl, and $6.01/bbl, respectively.
During this year's first quarter, the Canadian dollar weakened relative to the US dollar largely reflecting lower crude oil prices. The Canadian dollar averaged 73¢ in this year's first quarter, a decrease of 8¢ from first-quarter 2015.
Western Canada Select averaged $19.30/bbl and $33.88/bbl, respectively, for the first quarters of 2016 and 2015.
US firms
ExxonMobil Corp. reported estimated first-quarter earnings of $1.78 billion compared with $5 billion in first-quarter 2015. The impacts of sharply lower commodity prices and weaker refining margins were partly offset by strong chemical results. Capital and exploration expenditures for the quarter were reduced 33% to $5.1 billion year-over-year.
Upstream earnings declined $2.9 billion from first-quarter 2015 to a loss of $76 million. Oil equivalent production increased 1.8% from first-quarter 2015, with liquids up 11.5%, reflecting new project capacity additions, and gas down 9.3%. The US upstream operations recorded a loss of $832 million compared with a loss of $52 million in first-quarter 2015. Non-US upstream earnings were $756 million, down $2.2 billion from the prior year's first quarter.
Downstream earnings were $906 million, down $761 million from first-quarter 2015. Weaker margins decreased earnings by $860 million. Chemical earnings increased 38% to $1.4 billion on stronger margins and higher sales volumes.
Chevron Corp. reported a net loss of $707 million for this year's first quarter compared with earnings of $2.6 billion in 2015's first quarter. Foreign currency effects decreased earnings in this year's first quarter by $319 million compared with an increase of $580 million a year earlier. Capital and exploratory expenditures in first-quarter 2016 were $6.5 billion, down from $8.6 billion in the corresponding 2015 period.
US upstream operations incurred a loss of $850 million in this year's first quarter compared with a loss of $460 million a year earlier. International upstream operations incurred a loss of $609 million in the first quarter compared with earnings of $2.02 billion in first-quarter 2015. Worldwide net oil-equivalent production was 2.67 million b/d in this year's first quarter compared with 2.68 million b/d in 2015's first quarter.
US downstream operations earned $247 million in the first quarter compared with earnings of $706 million a year earlier. The decrease was primarily because of lower margins on refined products, an asset impairment, higher operating expenses primarily due to planned turnaround activity in this year's first quarter, and lower earnings from half-owned Chevron Phillips Chemical Co. LLC (CPCC). International downstream operations earned $488 million in the first quarter compared with $717 million in first-quarter 2015.
ConocoPhillips reported a first quarter net loss of $1.45 billion compared with first-quarter 2015 earnings of $286 million. Excluding special items, the firm reported an adjusted first-quarter net loss of $1.2 billion compared with a first-quarter 2015 adjusted net loss of $222 million. Special items of the current quarter were related to noncash impairments in the Gulf of Mexico and UK and pension settlement expense.
ConocoPhillips's production for the first quarter was 1.57 million boe/d, a decrease of 32,000 boe/d compared with the same period a year ago. This was because of normal field decline and impacts from dispositions, the company said. Operating costs were lower by more than 20% year-over-year.
Chesapeake Energy Corp. reported a net loss of $921 million for this year's first quarter compared with a net loss of $3.7 billion in 2015's first quarter. Included in the first-quarter loss was a noncash impairment of the carrying value of Chesapeake's oil and natural gas properties of $853 million. A $4.9-billion property impairment was incurred in 2015's first quarter.
Chesapeake's revenues in this year's first quarter declined 39% year-over-year. Total capital investments were $365 million during this year's first quarter, down from $1.5 billion in 2015's first quarter.
EOG Resources Inc. reported a first-quarter net loss of $471.8 million compared with a first-quarter 2015 net loss of $169.7 million, as lower commodity prices more than offset well productivity improvements and cost reductions. During this year's first quarter, the company's lease and well expenses decreased 29% and transportation costs decreased 12% compared with the same period a year ago, both on a per-unit basis.
EOG's exploration and development expenditures, excluding property acquisitions, for this year's first quarter decreased 61%, while total crude oil and condensate production declined 10% compared with first-quarter 2015. Total natural gas production for this year's first quarter decreased 3% vs. the prior year period.
Occidental Petroleum Corp. announced net income of $78 million for this year's first quarter. Core income for the first quarter was a loss of $426 million. Total company first quarter capital spending declined $500 million from fourth-quarter 2015.
The company's total oil and gas aftertax results reflected a loss of $388 million for this year's first quarter compared with losses of $189 million for fourth-quarter 2015 and $22 million for first-quarter of 2015, caused by the continued decline in commodity prices.
The company's Permian resources production increased 30%, or 30,000 boe/d, year-over-year, in the first quarter, while operating costs improved 33%. Total oil and gas cash operating costs were 23% lower compared with first-quarter 2015.
Hess Corp. reported a net loss of $488 million in this year's first quarter compared with a net loss of $389 million in the same quarter in 2015. Adjusted first-quarter net loss was $509 million compared with adjusted net loss of $279 million a year earlier. First-quarter results reflected lower realized selling prices, partially offset by lower operating costs and other expenses vs. the prior-year quarter.
The company's exploration and production capital expenditures were $544 million in this year's first quarter, down from $1.24 billion in the prior-year quarter.
Refiners
Valero Energy Corp. reported net income of $513 million for this year's first quarter, down from $968 million for first-quarter 2015. First quarter net income included a net aftertax benefit of $212 million related to the company's lower of cost or market (LCM) inventory valuation reserve.
The refining segment reported $695 million of adjusted operating income for this year's first quarter compared with $1.6 billion for first-quarter 2015, primarily attributable to weaker distillate margins.
Valero's refineries achieved 96% throughput capacity utilization and averaged 2.9 million b/d of throughput volume in this year's first quarter, an increase of 169,000 b/d from first-quarter 2015, attributable primarily to less maintenance activity in the first quarter.
HollyFrontier Corp. reported first-quarter net income of $43.4 million for this year compared with first-quarter 2015 income of $242.7 million. The decrease in net income reflected lower refining margins, and the costs associated with blending ethanol and purchasing RINs to comply with the RFS mandate. Included in the quarter results was a noncash inventory valuation adjustment that increased aftertax earnings by $37 million.
The firm's consolidated refinery gross margin was $7.59/bbl, a 55% decrease vs. $16.69/bbl for first-quarter 2015. Margins were impacted by seasonally weak gasoline cracks and continued weakness in diesel cracks.
Phillips66 reported first-quarter earnings of $398 million compared with $997 million in first-quarter 2015. Refining adjusted earnings were $86 million, down from $495 million in first-quarter 2015, because of weaker gasoline and distillate margins. Chemical adjusted earnings, reflecting Phillips66's equity investment in CPCC, were $156 million compared with $203 million in first-quarter 2015, because of lower polyethylene sales prices.
Marathon Petroleum Corp. reported a net loss of $78 million for this year's first 3 months compared with earnings of $903 million in 2015's first quarter. Its refining and marketing segment lost $62 million in this year's first quarter compared with an income of $1.29 billion in first-quarter 2015. The decline in first-quarter earnings was largely attributable to weak crack spreads in this year's first quarter compared with unusually strong first-quarter crack spreads in 2015, as well as higher direct operating costs related to increased turnaround activity.
Canadian firms
All financial figures in this section are presented in Canadian dollars unless noted otherwise.
Suncor Inc. recorded net earnings of $257 million in this year's first quarter compared with a net loss of $341 million in first-quarter 2015. Net earnings for this year's first quarter included a noncash aftertax foreign exchange gain on the revaluation of US dollar denominated debt of $885 million compared with an aftertax foreign exchange loss of $940 million in the same quarter a year ago.
The company's operating losses in this year's first quarter were $500 million compared with operating earnings of $175 million in 2015's first quarter. This reflected the 31% decline in the WTI benchmark price, a 43% decline in the WCS benchmark price, combined with a wider bitumen-to-WCS differential, as well as a decrease of 40% in benchmark crack spreads compared to first-quarter 2015.
The company's total upstream production was 691,400 boe/d in this year's first quarter compared with 602,400 boe/d in the prior year's first quarter, with the increase due mainly to an additional 36.74% working interest in Syncrude associated with the Canadian Oil Sands Ltd. acquisition and increased oil sands operations production.
During this year's first quarter, Suncor began planned maintenance at its Commerce City refinery. Average refinery utilization remained strong at 91% in the first quarter compared with 95% in 2015's first quarter, despite weaker demand and the planned turnaround.
Encana Corp. reported a net loss of $491.5 million in the first quarter compared with a loss of $2.21 billion in first-quarter 2015. Aftertax noncash ceiling test impairments were $787 million and $1.58 billion, respectively, for this year's first quarter and first-quarter 2015. This year's first-quarter results included a nonoperating foreign exchange gain of $382 million, while first-quarter 2015 recognized a foreign exchange loss of $659 million.
The company's total liquids production for the quarter averaged 130,800 b/d, an increase of 8% from the same period in 2015. Natural gas production in the first quarter averaged 1.5 bcfd.
Imperial Oil Ltd.'s net loss for this year's first quarter was $101 million compared with a net income of $421 million for 2015's first quarter. Capital expenditures for the first 3 months of this year were $408 million, down from $1.05 billion a year earlier.
The company's upstream segment recorded a net loss in the first quarter of $448 million compared with a net loss of $189 million in first-quarter 2015, reflecting lower crude prices, partially offset by the impact of a weaker Canadian dollar. Production for the first quarter averaged 421,000 boe/d, up 26% from 333,000 boe/d a year ago.
Downstream net income was $320 million in the first quarter compared with $565 million in the same period in 2015. Earnings decreased mainly because of lower refinery margins.
Cenovus Energy Inc. ended this year's first quarter with a net loss of $118 million compared with a net loss of $168 million in the same period of 2015. The improvement was primarily because of nonoperating unrealized foreign-exchange gains of $413 million compared with unrealized losses of $514 million a year ago, offset by lower commodity prices this year and an asset impairment of $170 million related to its northern Alberta conventional oil assets.
During the first quarter, the company's upstream operating cash flow was down 63% to $167 million. Oil sands operating costs were also down 13% to $9.52/bbl compared with the same period in 2015.
Refining and marketing operations had an operating cash flow loss of $23 million during this year's first quarter compared with operating cash flow of $95 million in the same period a year ago. This was primarily because of a 41% decline in market crack spreads driven by seasonal weakness, high storage levels for refined product, and the narrowing of the Brent-WTI price differential compared with the same period a year ago.
Enbridge Inc.'s first-quarter earnings were $1.347 million compared with a loss of $221 million in first-quarter 2015. Adjusted earnings for this year's first quarter were $663 million compared with adjusted earnings of $468 million in 2015's first quarter. The increase was driven by record throughput growth on the liquids mainline system and the impact of new projects coming into service in second-half 2015.


