Economic methodology predicts well performance with public data
Simin Sadeghi
Texas A&M University
College Station, Tex.
Considering the growing importance of North American shale gas in the last 10 years and the difficulty in characterizing these reservoirs, petroleum data-driven analysis could help develop predictive well-performance models, leading to rapid evolution of scoping studies.
This article proposes methodology to predict horizontal well performance using publically available completion data sets from Canada's Montney formation, covering 50,000 sq miles of Alberta and British Columbia. As one of the country's major economically viable formations it will attract more industrial attention in the near future.
Average cost for a Montney formation horizontal well is $5-8 million. Despite this expense, the play has the potential to become one of the largest gas producing formations in Canada. Operators have drilled and completed more than 2,000 wells in the formation and most of the data are publically available.
Data rich
Shale's natural heterogeneity makes it difficult to identify the impact of different parameters on well performance. Conventional reservoir simulation is an expensive and time-consuming approach to evaluating these fields.
Plays such as Montney, with thousands of wells comprising a massive production and completion database, lend themselves to the data mining and advanced statistical analysis that are promising tools for completion optimization and quick economic evaluation.
Slickwater variation
This article presents a multivariate linear regression method performed on public domain data from 440 Montney wells in British Columbia. Completion parameters such as lateral length, number of stages and perforation clusters, and amounts of injected fluid and sand helped build a predictive model for well performance. Combining these completion variables into one model with multivariate analysis enables this tool to predict production rates based on completion variables that can match actual production data.
Fracture-fluid type subdivided the 440 wells. The slickwater subgroup is large enough, with 127 wells, for valid statistical analysis. Because slickwater wells are scattered throughout the Montney, which also represents a variation of rock properties, the assumption is that completion parameters for historic wells provide no acceptable model.
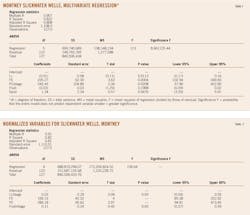
Multivariate regression analysis can identify strong correlations with well performance in slickwater wells across the play when viewed by the number of fracture stages and perforation clusters. Lateral length does not share this correlation with well performance. For the Montney, longer slickwater treated laterals do not ultimately lead to better performing wells. Table 1 shows the multivariate analysis on 127 slickwater wells in the Montney formation.
The positive coefficient indicates the increase in production rate if the completion variable increases by its unit; therefore, in Equation 1 (see box) if the number of fracture stages increases by one, the best 12-month production average (B12) will increase by 226 Mcfd. When the perforation clusters increase by one, production rate will increase by 245 Mcfd. A negative coefficient represents the decrease in production rate if the completion variable increases. Both fluid and lateral length have negative coefficients; increasing lateral length by 1 m decreases production rate. The intercept is intentionally forced to be zero, which means when there is no completion the production rate will be zero.
Significant variables
For Table 1, the adjusted R square (goodness-of-fit, and different from R2) is 0.808. The P-value for each completion is the probability that the variable is insignificant in the model and can be omitted. Typically, a P-value of less than 5% shows the variable is important to the model. For example, in Table 1, lateral length with a P-value of 0.91, fluid with a P-value of 0.19, and sand with a P-value of 0.56 do not contribute to the model, however, the number of fracture stages and number of perforation clusters, with P-values less than 0.05, are significant variables in the model.
The lower and upper 95% confidence intervals show the uncertainty in each completion variable coefficient. For example, the lower and upper 95% confidence intervals for the number of fracture stages vary between 102 and 349. Confidence range is completely positive for the number of fracture stages and perforation clusters/stage, showing these two completion variables as having a positive impact on well performance. Lateral length, fluid, and sand have an uncertain impact on well performance based on the 95% confidence intervals because their lower 95% is a negative number but the upper 95% is a positive number.
The most influential variable in slickwater wells in the Montney play is the number of fracture stages (Table 1), suggesting operators of slickwater-treated wells should complete more stages with shorter spacing rather than longer laterals.
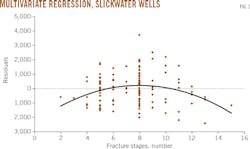
Residual plots are one of the outputs of multivariate regression analysis. A residual plot shows the difference between predicted and actual production. This study tracks the residual plots for the number of fracture stages, the most important completion parameter in the model (Fig. 1). In an ideal situation, the residual plot should have normal distribution with a mean of zero and without a discernible pattern. Fig. 1 shows a concave pattern with negative residuals close to the limits of the maximum and minimum number of fracture stages. This pattern signifies that the model has room for improvement.
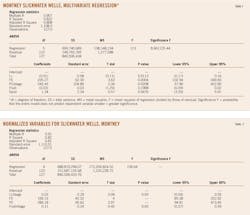
Similar analyses are possible on data grouped by geographical area providing there are enough wells in each group. Completion variables are normalized by the number of fracture stages and repeated analysis. Equation 2 is the best-normalized deterministic model. There is no sand in this model. Lateral length/stage and fluid/stage also are insignificant to the model, and the number of fracture stages and perforation clusters are the most important variables. This deterministic model can be improved by applying Monte Carlo simulation and converting it to a probabilistic model. Table 2 is the output of multivariate regression with normalized variables.
Monte Carlo simulation
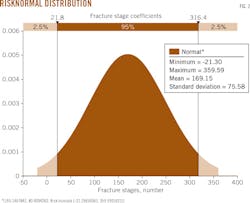
To convert the deterministic model to a probabilistic one, this study defines distribution for each of the coefficients. For each coefficient, normal distribution is paired with a mean equal to the coefficient in the output of the multivariate regression, which is used as a mean of distribution. The number of fracture stages, for example, has a normal distribution with a mean of 169.1 and a standard deviation of 84.6, two times the original standard error in Table 2 (Fig. 2). This study repeats the same procedure for the other three variables shown in Fig. 2.
Truncating the distribution four times of standard deviation from the mean deletes the model's negative part. Multipliers account for the lack of variables such as rock permeability and other properties not included in the model. This step allows the generation of actual production data within the probabilistic multivariate regression. The variables with less influence on B12 such as lateral length/stage and fluid/stage were computed with a higher variance multiplier (3.5 and 3). Lower multipliers (1.9 and 1.7) were applied to influential completion variables such as number of fracture stages and perforation clusters/stage (Table 3).
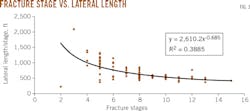
The next step involves building a correlation matrix based on the square root of 2D regression for each variable of the 127 slickwater wells. For example, the R2 of the 2D regression plot of exponential trend of lateral length/stage vs. number of fracture stages is 0.39. The square root of R2 is 0.18, the element in the correlation matrix (Fig. 3). The correlation matrix will force the Monte Carlo random number generator to select random variables correlated to each other. As an example, to contend with the high number of fracture stages, the simulator will select shorter lateral lengths per stage according to Fig. 3.
This study determined the best-fit distribution of the completion data for each completion variable's distribution. Each of the completion parameters were truncated between their minimums and maximums in the database to force the simulator to model the actual range of values.
After defining distributions for the completion variables and their coefficient and correlation matrix, Monte Carlo simulation ran 20,000 iterations. The model then used Latin hypercube sampling to average all computed B12 data, stopping when the averages converged within 1%.
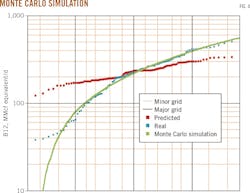
Fig. 4 shows the result of Monte Carlo simulation (green dots) and real production data (red dots). The Monte Carlo simulation followed the deterministic regression (blue dots) for 95% of the data range.
Well performance prediction
Multivariate regression can predict well performance in a model closely resembling actual production results. Well completion parameters such as number of fracture stages and perforation cluster influence well performance. Quantifying this impact can lead to optimized completions and improved well performance. This study applied probabilistic multivariate regression analysis to publicly available completion and production data to measure the impact of each parameter on well performance and identify which completion parameters have the highest impact on production. For mature fields where production and well completion are gathered consistently, this method may eliminate the need for reservoir simulation.
The author
Simin Sadeghi ([email protected]) is a PhD candidate at Texas A&M University, College Station. She has also served as research and teaching assistant and as reviewer for several journals including Energy Strategy, International Journal of Modeling and Simulation for the Petroleum Industry, and International Journal of Oil, Gas, and Coal Technology. She holds an MS from Texas A&M University. She is a member of the Society of Petroleum Engineers, Independent Petroleum Association of America, and Houston Geological Society.
