Ultrasonic test redesigns sample geometries, identifies high-resolution anisotropy in shale
Ji Soo Lee
Chesapeake Energy Corp.
Oklahoma City
A new ultrasonic test method can acquire high-resolution shale data in the lab by using new geometries for sample testing with specialized equipment suited for measuring shale formations at reservoir conditions. The ultrasonic 1⁄3-slab test alleviates problems associated with sampling and fills gaps that often result in poor data resolution found with other technologies in field-scale applications.
Octagonal and dodecagonal methods allow ultrasonic testing to measure acoustic anisotropy and heterogeneity with improved precision at 45° and 30° increments, respectively. Integrated analysis and interpretation resulting from the acoustic tests can calibrate well logs, improve reservoir characterization, and enhance completion designs.
Shale formations make up a large portion of the world's sedimentary basins. Shale has a great deal of mechanical anisotropy. Proper sampling dimensions in laminated shale cores can be difficult to obtain.
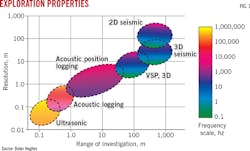
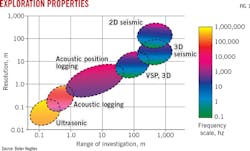
Oil and natural gas exploration employs a variety of acoustic investigations to identify specific locations and accurate reserves estimates of commercial hydrocarbon deposits. Seismic surveys are important tools for exploring reservoirs and evaluating formations, but their wide data resolution can often skip important geophysical and petrophysical features. Acoustic logs provide reservoir information at wellbore scales with moderate frequency and data resolution.
Other methods include vertical seismic profiles (VSP) and ultrasonic tests. Depending on the coverage desired and the level of investigation, operators tailor tools and applications to fit specific needs. Seismic and VSP are viable for exploring a wide range of fields both horizontally and vertically through multiple formations, but also provide poor data resolution. Ultrasonic tests measure small specimens at laboratory-scale using low frequencies and often provide higher data resolution (Fig. 1).
Elastic properties variation
Anisotropy is the directionally dependent variation of physical and mechanical properties.1 2 Acoustic anisotropy is a directional variation in velocities within a spatial sequence of bedding planes, fractures, laminations, grains, and pore structures. Waves will propagate differently parallel or perpendicular to bedding and fastest in the stiffest directions 6 Acoustic anisotropy is a key parameter for seismic data processing because it strongly influences interpretations of seismic surveys, formation evaluations, pore pressure predictions, and microseismic monitoring.6-9
Shale exhibits a high degree of intrinsic and mechanical anisotropy due to platy clay particles, kerogen, and laminations aligned parallel to the bedding.10-13 This combination creates vertically transverse isotropy (Fig. 2).14 15
Ultrasonic testing
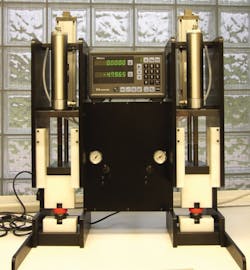
One difficulty in laboratory testing of rock mechanics is obtaining properly dimensioned samples in laminated shale cores. Through modification and specialized equipment, Chesapeake Energy Corp.'s Reservoir Technology Center created a new ultrasonic test system designed to measure wave velocities and elastic properties of unconventional rocks (Fig. 3). Shale cores possess intervals with tightly spaced horizontal laminations. Typical laboratory tests require 2-in. vertical plugs, but the nature of shale core samples makes obtaining these plugs difficult if not impossible.16-18 Chesapeake's new ultrasonic test trims samples to 1-in. to alleviate problems associated with larger samples.
Each pneumatic ram applies a contact force of about 100 lbs, with 120 psi of axial stress, based on the surface area of the specimen. This process expels air or gas captured in pores, laminations, and pre-existing cracks and fractures in shale samples.
The test measures wave velocities in as-is (or as-received) cores and converts them to elastic properties as close as possible to reservoir conditions. To preserve formation gas, oil, and any fluids, the 2⁄3-butt section cores are wrapped with plastic following the cutting process. The 1⁄3-slab section cores are exposed to ambient conditions, allowing moisture and some light hydrocarbon captured in specimens to dry over time.
This study saturated the 1/3-slab specimens in 5% potassium chloride for 2 days. Saturation is necessary due to the low axial stress applied during testing. Wave velocities are more affected by saturation in shale samples than in porous sandstones. Partial drying limited detection through Young's modulus without saturation or high axial stress, but the data maintained reasonable ranges. Invalid results were clearer in Poisson's ratio, as data were expressed in low or negative values. Typical field-level ultrasonic testing is not an efficient approach in laboratory experiments.19-22
Sample geometry
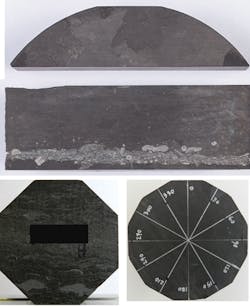
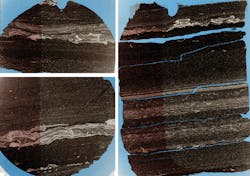
Fig. 4a represents the 1⁄3-slab specimen used to measure ultrasonic wave velocities in vertical and horizontal directions. These types of specimens provide greater data resolution at every inch when measuring acoustic anisotropy in vertical and horizontal orientations, as long as the 1⁄3-core samples are sound. Sample preparation can be limited if fractured zones are too tight, such as with "poker-chip" type fractures, when there are rubblized zones, or when cores have vertically broken parts due to drilling-induced fractures.
Usually, 1⁄3-slab specimens are prepared at every 1-2 in. depending on the intent of the experiment or sample lithology. Anisotropic or heterogeneous core sections employ sampling every 1 in. For rocks that contain similar lithology, such as a clean sandstone section with a uniform particle-size distribution or fewer pre-existing microfractures, sampling occurs every 2 in. Octagonal specimens allow for anisotropy measurements at every 45° (Fig. 4b).
Samples are prepared in a vertical direction using the 2⁄3-butt sections harvested with a 2-in. coring bit. After coring, the 1-in. thick sample is cut and ground at every 45°.
Most acoustic anisotropy experiments measure wave velocities at only three directions: vertical, 45°, and horizontal. The measurements are provided with an assumption that each opposite direction must generate the same velocities. But natural rocks include different minerals, particle sizes, pore sizes, and heterogeneous mineral elongations. These assorted features also lead to different wave velocities, but these heterogeneity-based differences are smaller than the anisotropic differences.
This study introduces a new dodecagonal sampling technique to measure heterogeneous characteristics at every 30° (Fig. 4c). The sample is extracted along a horizontal direction, not vertically, through the 4-in. diameter core section.
Anisotropy measurement
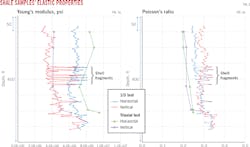
Fig. 5 compares anisotropy in elastic properties measured by dynamic triaxial compressive tests and ultrasonic 1⁄3-slab tests. Triaxial compressive tests require discrete samples because of high cost, long experiment time, and limited sampling. Researchers therefore select a small plug (1-in. width, 2-in. length) for rock mechanics tests, but it is impossible to extract samples with these dimensions in highly laminated cores. One-third slab samples by comparison are flexible, fast, and inexpensive to prepare.
This study conducted five triaxial compressive tests and 80 ultrasonic 1⁄3-slab tests to investigate elastic properties in reservoir formations (Fig. 5). The triaxial compressive tests applied 3,000 psi confining stress and the ultrasonic 1⁄3-slab tests were conducted with no confinement.
The different magnitudes in elastic properties from both tests are based on their different confining stress conditions. Dominant data spikes occur in the zone of shell fragments detected by the ultrasonic 1⁄3-slab test (Fig. 5), unlike the triaxial compressive tests which skipped this specific feature.
This shell-fragment example shows the circumstances in which seismic, VSP, or acoustic well logs may bypass lithological variations mostly seen in unconventional formations. This high-frequency laboratory experiment, however, conducted on small specimens with high sampling rates, can cover and interpolate intervals missing from larger, lower frequency field-scale exploration techniques.
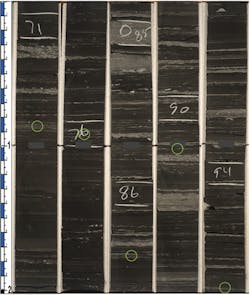
The grey-colored areas in Fig. 6 consist of bioclastic shell debris. Accumulations of shell debris range from disseminated fragments to thin beds. The length of this column is 2 ft. Each data point is designated by a circular mark on the photo. All sampling spots show horizontally layered shell fragments composed of calcite.
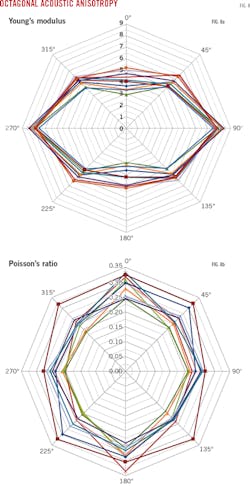
The test measured anisotropy in elastic properties in 10 octagonal specimens at every vertical 45° angle (Fig. 8). Young's moduli are higher along the horizontal direction. In contrast, Poisson's ratios are lower in the opposite trend.
This mechanical anisotropy comes from the horizontally layered shell fragments. The results infer that the samples are stiffer horizontally and identically match the ultrasonic 1⁄3-slab test results showing high spikes in Young's moduli in Fig. 5.
Heterogeneity in elastic properties was measured using three dodecagonal specimens at every horizontal 30° angle (Fig. 9). Young's moduli are slightly different in the specimens. For example, Sample 2 shows a higher Young's modulus along 60°-120° (Fig. 9a). For Poisson's ratio, Sample 1 shows the relatively higher value along 60°-90° (Fig. 9b). Overall, the degree of variance in elastic properties due to heterogeneity is not as dominant as that due to anisotropy (Fig. 8). The scale of anisotropy with bedding planes, fractures, and laminations is greater than heterogeneity in platy clay samples.
References
1. Sheriff, R.E., "Encyclopedic dictionary of applied geophysics," Geophysical References Series 13, Society of Exploration Geophysicists (SEG), 2001.
2. Thomsen, L., "Understanding seismic anisotropy in exploration and exploitation," SEG-European Association of Geoscientists and Engineers (EAGE) Distinguished Instructor Series 5, SEG, 2001.
3. Schlumberger, "Formation anisotropy: Reckoning with its effects," Oilfields Review-Reservoir Engineering, Vol. 2, No. 1, Jan. 30, 1990, pp. 16-23.
4. Armstrong, P., Ireson, D., Chmela, B., Dodds, K., Esmersoy, C., Hornby, B., Leaney, S., and Lynn, H., "The promise of elastic anisotropy," Schlumberger, Oilfield Review, Vol. 6, No. 4, Oct. 1, 1994, pp. 36-47.
5. Bachranch, R. and Sayers, C., "New method characterizes naturally fractured reservoirs," Hart's E&P, Aug. 1, 2014.
6. Market, J., Mejia, C., Multu, O., Shahri, M.P., and Tudge, J., "Untangling acoustic anisotropy," Society of Petrophysicists and Well Logging Analysts Annual Logging Symposium, Long Beach, Calif., July 18-22, 2015.
7. Tatham, R.H., McCormack, M.D., Neitzel, E.B., and Winterstein, D.F., "Multicomponent seismology in petroleum exploration," Investigation in Geophysics No. 6, SEG, 1991.
8. Ostadhassan, M., Zeng, Z., and Jabbari, H., "Anisotropy analysis in shale using advanced sonic data - Bakken case study," American Association of Petroleum Geologists (AAPG) Annual Convention, Long Beach, Calif., Apr. 22-25, 2012.
9. Sone, H. and Zoback, M.D., "Mechanical properties of shale gas reservoir rocks - Part 2: Ductile creep, brittle strength, and their relation to the elastic modulus," Geophysics, Vol. 78, No. 5, September-October 2013, pp. 381-392.
10. Hornby, B.E., Schwartz, L.M., and Hudson, J.A., "Anisotropy effective-medium modeling of the elastic properties of shales," Geophysics, Vol. 59, Oct. 1, 1994.
11. Johnston, J.E. and Christensen, N.I., "Seismic anisotropy of shales," Journal of Geophysical Research, Vol. 100, No. B4, Apr. 10, 1995, pp. 5,991-6,003.
12. Sayers, C.M., "Seismic anisotropy of shales," Geophysical Prospecting, Vol. 53, No. 5, September 2005, pp. 93-98.
13. Sondergeld, C.H. and Rai, C.S., "Elastic anisotropy of shales," The Leading Edge, Vol. 30, No. 3, March 2011.
14. Sayers, C.M., "The elastic anisotropy of shales," Journal of Geophysics Research, Vol. 99, 1994, pp. 767-774.
15. Vernik, L. and Liu, X., "Velocity anisotropy in shales-A petrophysical study," Geophysics, Vol. 62, March-April 1997, pp. 521-532.
16. Lee, J.S., Smallwood, L., and Morgan, E., "New application of rebound hardness numbers to generate logging of unconfined compressive strength in laminated shale formations," U.S. Rock Mechanics/Geomechanics Symposium, June 1-4, 2014, Minneapolis, Minn.
17. Lee, J.S., "Calibration of rebound hardness numbers to UCS in shale formations," Journal of Petroleum Technology, Vol. 67, No. 1, January 2015, pp. 41-45.
18. Lee, J.S., Kieschnick, J., Geyer, C., Brumley, J., and DeSpain, L., "Comparison of different methods to estimate unconfined compressive strength in a Barnett shale," U.S. Rock Mechanics/Geomechanics Symposium, June 26-29, 2016, Houston, Tex.
19. Thomsen, L., "Poisson was not a geophysicist," The Leading Edge, Dec. 1, 1990, pp. 27-29.
20. Stewart, R., and Lawton, D.C., "P-S seismic exploration: A mid-term overview," CREWES Research Report, Vol. 8, 1996, p. 34.
21. Calvert, A., and Aldridge, D.F., "Ambiguity in resolving the elastic parameters of gas sands from wide-angle AVO," Canadian Society of Exploration Geophysicists (CSEG), 2002, p. 5.
22. Gretener, P., "Summary of the Poisson's ratio debate 1990-2003," CSEG Recorder, Vol. 28, No. 7, September 2003.
The author
Ji Soo Lee ([email protected]) is supervisor of the Reservoir Technology Center at Chesapeake Energy Corp., Oklahoma City. He has also served as senior geoscientist and senior geomechanics engineer at Baker Hughes Inc. He holds a PhD (2007) in mining and geological engineering at the University of Arizona, Tuscon, an MS (2001) in Earth system sciences from Yonsei University, Seoul, and a BS (1999) in Earth and environmental sciences from Andong National University, Andong City, South Korea. He is a member of SPE, the American Rock Mechanics Association, and the International Society for Rock Mechanics.
