Oil market, still oversupplied, to ease toward balance in 2016

Conglin Xu
Senior Editor-Economics
Laura Bell
Statistics Editor
Global oil markets remain oversupplied at the start of 2016, with inventories at record-high levels, the Organization of Petroleum Exporting Countries refusing to set production limits, and supplies from Iran set to increase.
As oil prices dip below $40/bbl, non-OPEC supply is shrinking fast. After leaping by 3.7 million b/d during 2008-14, annual average US crude oil production will be down 400,000 b/d in 2016.
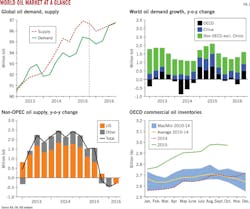
According to the International Energy Agency, global oil demand grew by 1.8 million b/d in 2015 on the strength of better-than-expected demand from countries in the Organization for Economic Cooperation and Development and steady non-OECD growth. In 2016, global demand growth will slow slightly.
Shrinking non-OPEC supply, growing demand, and depleted OPEC spare production capacity should move the global oil market toward balance and strengthen the crude price by late 2016. OPEC crude production will remain the wild card.
In the US natural gas market, rising production, record-level storage, and mild winter weather will suppress prices.
World economy growing
The US dollar has appreciated by more than 10% in real effective terms since mid-2014, while many commodity exporters with flexible exchange rate experienced sizable currency depreciation. Growth has slowed considerably among commodity-exporting emerging markets and developing economies.
In its most recent World Economic Outlook (WEO), issued in October, the International Monetary Fund (IMF) estimated global growth of 3.1% in 2015, down from 3.4% in 2014, but projected growth of 3.6% in 2016.
In advanced economics, growth rates of 2% in 2015 and 2.2% projected for 2016 are stronger than in the recent past. Last year's strength reflected the modest recovery in the euro area and a return to growth in Japan, supported by declining oil prices, supportive monetary policy, and, in some cases, currency depreciation.
The pickup in advanced economies is tempered by lower growth in commodity exporters-particularly Canada and Norway-and in Asia outside of Japan.
IMF also noted that, although unemployment is declining, underlying productivity growth in advanced economies remains weak, including in the US, where the recovery is more entrenched.
Emerging-market economic growth is hovering close to 4% in 2015 vs. 4.6% in 2014, reflecting declining commodity prices, export weakness, and the realigned Chinese economy. Brazil is in the worst recession since the 1930s, while India is the bright spot in emerging markets, generating growth in gross domestic product of 7.3%.
Improvement is projected this year in emerging-market and developing economies, with growth forecast at 4.5%. In particular, economic performances of countries in distress in 2015 (including Brazil, Russia, and some countries in Latin America and the Middle East), while remaining weak or negative, are projected to be stronger this year, more than offsetting the expected slowdown in China. Contributing to the improvement are recessions less deep than before, spillover from the stronger pickup in activity in advanced economies, and the easing of sanctions on Iran.
The IMF projects that China's growth will slow to 6.3% in 2016 from 6.8% in 2015, as the government has attempted to increase the economic role of domestic consumption.
Oil demand rising
Global growth in oil demand of 1.2 million b/d is forecast in 2016 by the IEA. Last year's demand increase was the highest in 5 years, supported by robust gains from China, the US, India, and Europe.
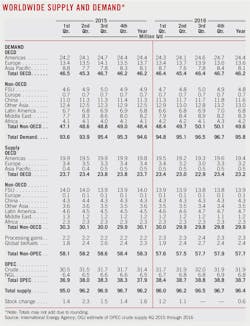
In 2015, total OECD demand increased to 46.2 million b/d from 45.7 million b/d a year earlier. Oil demand in OECD Americas averaged 24.4 million b/d vs. 24.1 million b/d a year earlier, led by strong US gasoline demand. Demand averaged 13.7 million b/d in OECD Europe, up from the 2014 average of 13.4 million b/d, led by rising diesel fuel demand. Demand from OECD Asia Oceania was down slightly.
Outside the OECD last year, collective demand grew to 48.4 million b/d from 47.1 million b/d a year earlier.
Despite the macroeconomic backdrop and the consensus of earlier expectations, Chinese demand climbed to 11.3 million b/d in 2015 from 10.6 million b/d a year earlier, half of total non-OECD growth. Gains were robust in consumption of gasoline, jet fuel, and LPG/ethane.
Oil demand in 2016 in OECD countries, averaging 46.2 million b/d, will be little changed from the 2015 level. Growth of 1.2 million b/d in non-OECD demand will account for the global demand increase. The expected demand slowdown reflects factors in last year's growth unlikely to be a strong this year.
IEA estimated that demand in OECD Europe countries will dip in 2016, while demand across OECD North America and OECD Asia Pacific will be largely flat.
Asia excluding China will post the largest demand gain in the non-OECD group in 2016, adding about 500,000 b/d to 13 million b/d. China's oil demand in 2016 is expected to increase to 11.6 million b/d.
Global supply mix
Outside the US and OPEC, oil production increased more than 300,000 b/d, outpacing expectations. Brazil, Canada, and Russia contributed important gains.
Despite a plunging rig count, US liquids production proved resilient because of improving efficiency onshore and growth in in the Gulf of Mexico. Average US crude and condensate production was up 7.7% for the year, at 9.32 million b/d. In the major shale plays, production at the end of the year was falling month-to-month by more than 100,000 b/d, with only the Permian basin continuing to show increases.
OPEC crude supply averaged an estimated 31.4 million b/d in 2015, up 1.1 million b/d from the 2014 average on the strength of increases in Saudi Arabia and Iraq. Saudi production jumped to 10.2 million b/d from 9.7 million b/d in March 2015 and remained at that level or above at least through November. Iraqi output reached a record high 4.5 million b/d in November after averaging 3.7 million b/d in the first half of the year, according to EIA.
Average oil supply reached 96.2 million b/d in 2015, implying a strong, 1.6 million b/d build in inventories.
On Dec. 4, OPEC took no action on either the group production target or actual output despite global oversupply. Also at the meeting, OPEC members voted unanimously to reactivate Indonesia's OPEC membership, despite its remaining a net importer of crude oil.
IEA projects NGL production by OPEC members, which is not subject to the group's output ceilings, will continue to climb, averaging 6.8 million b/d this year, led by increases in Iran and Qatar. Last year the organization's NGL supply averaged 6.5 million b/d.
IEA calls for oil output to decrease in non-OPEC producers in 2016. The only non-OPEC region to post an increase will be Latin America, where output is forecast to average 4.7 million b/d vs. a year-earlier average of 4.5 million b/d. OECD Americas supply will average 19.4 million b/d this year, down 400,000 b/d from last year.
Including processing gains and global biofuels, IEA forecasts that 2016 non-OPEC supply will average 57.7 million b/d, down from last year's 58.3 million b/d.
OGJ estimates that OPEC crude output will average 31.9 million b/d this year, up 500,000 b/d from 2015, with Iran forecast to increase production once international sanctions targeting its oil sector are suspended, probably in the first half.
Since mid-2012, Iran's crude exports are down by more than 1 million b/d due to sanctions. Production is down by 750,000 b/d from presanction levels. IEA estimates that Iran could produce 3.4-3.6 million b/d, up 500,000-700,000 b/d from current levels, within 6 months of sanctions being lifted.
Demand and supply at projected levels imply an average stock build of 600,000 b/d this year, down more than half from the 2015 level. Most of the build is expected in the first half of the year. Global storage capacity should not come under pressure, according to IEA. A total of 230 million bbl of new storage capacity is to be commissioned in 2016, more than half in Chinese and Indian facilities for strategic storage, as well as new terminals in North America, China, the Middle East, and Europe.
Inventories in OECD countries in October were 260 million bbl above the average of the past 5 years, representing the largest overhang over 5-year average in at last 10 years.
US economy, energy
Economic data indicate the US economy will continue to grow, led by more solid gains in consumer spending and steady improvements in housing construction. OGJ forecasts that the US economy will grow 2.5% in 2016.
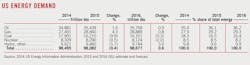
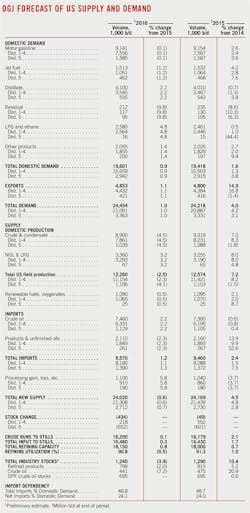
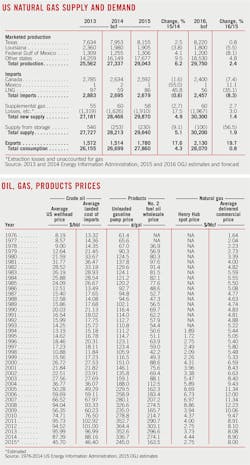
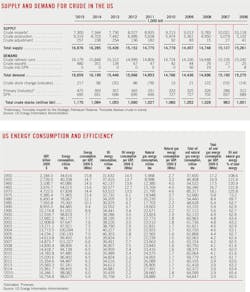
US energy demand will grow 0.6% this year, OGJ forecasts, following last year's contraction to 98.08 quadrillion btu (quads) from a 2014 total of 98.45 quads. The 2014 and 2015 numbers are from EIA and are subject to frequent revision.
Demand for petroleum products this year will grow only marginally, 0.9%, following growth of 1.6% last year. The expected slowdown reflects deceleration in gasoline, jet fuel, and "other products" demand. Oil will remain the dominant energy source in the US, holding 36.2% of the market.
Gas consumption is set to increase 0.8%, with lower residential and commercial consumption being offset by increases in the electric power and industrial market. This compares to a 4.3% increase last year. The natural gas market share will stand at 29.3% this year.
US oil demand
In 2015, US liquid fuel consumption growth was led by motor gasoline, which is estimated to have increased by 233,000 b/d, or 2.6%, as effects of lower gasoline prices and employment growth outweighed increases in vehicle-fleet efficiency. When fuel prices are low, vehicle buyers tend to favor sport utility vehicles and light trucks.
OGJ forecasts that gasoline demand will be essentially flat this year, averaging 9.14 million b/d. Higher pump prices and a resumption of the long-term trend toward improved vehicle fuel efficiency will offset the demand strengthening that comes with employment growth.
Demand for distillate fuel, which includes diesel fuel and heating oil, will increase 2.2% from a year ago to 4.1 million b/d this year. According to EIA data, US diesel consumption was flat in 2015 after growing strongly in 2013 and 2014, mirroring a slowdown in inland freight movements and the worldwide slowdown in raw materials production. Growth this year reflects recovery of those influences on diesel use.
Jet fuel demand averaged 1.53 million b/d during 2015, a 4.2% increase from a year earlier. Jet fuel demand will slip to 1.51 million b/d this year due to higher jet fuel prices and continued consumption efficiency.
OGJ forecasts that this year's demand for LPG and ethane will increase 4.8% from last year to 2.58 million b/d, reflecting increased propane demand and expanded petrochemical plant capacity.
Residual fuel oil demand, which has been declining for decades, will fall to 212,000 b/d this year from the 2015 average of 235,000 b/d.
Demand for all other petroleum products will increase 1.4%, following an increase of 2.75% a year ago, and average 2.05 million b/d. These products include petrochemical feedstocks, special naphtha, still gas, waxes, and miscellaneous products, as defined by EIA.
US output stalls
US crude oil production growth has ceased. OGJ forecasts average output in 2016 will drop to 8.9 million b/d from 9.32 million b/d last year. US crude oil production averaged 8.7 million b/d in 2014.
Average monthly US crude production peaked in April 2015 at 9.58 million b/d and declined in 5 of the six following months, according to the EIA. From the peak rate, production in November was down 420,000 b/d for total US and 460,000 b/d for the Lower 48.
According to EIA's Drilling Productivity Report, legacy declines from existing wells by December had been exceeding output from new wells since May, with total production set to fall by 115,000 b/d in the last month of 2015.
US shale oil producers, having slashed budgets throughout 2015, plan to pare spending further this year. Companies including Devon Energy Corp., Continental Resources Inc., and Marathon Oil Corp. released preliminary 2016 plans for capital spending that fall by double-digit percentages.
Output from the Gulf of Mexico averaged 1.54 million b/d in 2015, up 10.4% from the 2014 level. Twelve projects were scheduled to come online in the Gulf of Mexico in 2015 and 2016. In 2016, production from the gulf is expected to increase to 1.6 million b/d, while oil production in Alaska will continue to fall, reflecting declines from legacy fields.
With expected additions of natural gas processing, NGL production will climb to an average 3.36 million b/d this year from 3.25 million b/d in 2015 and 3.01 million b/d in 2014.
Crude imports to rise
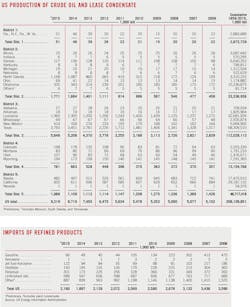
As Lower 48 oil production declines and the refining industry adds light crude processing capability, crude oil imports are likely to increase despite the end of a ban on crude exports. OGJ forecasts that the US will import 7.46 million b/d of crude in 2016. This will be a 2.2% increase after a 0.6% decline in crude imports last year.
In 2015, US product imports surged by 13.9%, reflecting strong domestic demand. Imports of petroleum products is forecast to fall by 2.3% this year to average 2.11 million b/d, driven by a slowdown in consumption growth, higher refinery throughput, and full storage.
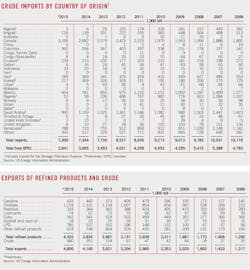
Last year, Canada was the top exporter to the US, averaging 3.2 million b/d. Saudi Arabia, which exported about 1 million b/d of crude to the US last year, was followed by Venezuela, Mexico, and Colombia.
Total crude imports from the OPEC countries averaged 2.64 million b/d last year, 36.2% of the total. In 2014, crude imports from OPEC averaged 3 million b/d, 40.9% of the total.
The US will export 4.85 million b/d of oil this year, mostly products. In 2015, US oil exports averaged 4.8 million b/d, up from 4.17 million b/d a year earlier. The end of the 40-year-old ban on crude oil exports should have little immediate impact on US oil trade.
Oil in storage
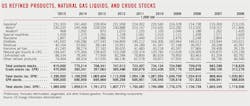
US commercial crude oil stocks in 2015, averaging 466 million bbl, were up 22% or 85 million bbl from the prior year. Stocks of motor gasoline were up 2% from last year to average 225 million bbl. Distillate fuel oil stocks were up 13% from the prior year to 139 million bbl. Average jet fuel stocks were up by 7% from the prior year. Total inventories of all oils excluding the Strategic Petroleum Reserve were up 13% from year ago levels, averaging 1.262 billion bbl.
Crude oil in storage, excluding that in the SPR, will fall to 440 million bbl at the close of 2016, OGJ forecasts. This is down from a yearend 2015 total of 475 million bbl, which was 22% higher than a year earlier.
The total volume of oil products in storage also will move lower from the end of 2015. OGJ forecasts that product stocks will total 799 million bbl at the end of this year, down from the year-earlier total of 815 million bbl.
The amount of crude in the SPR last year grew to 695 million bbl from 691 million bbl a year earlier.
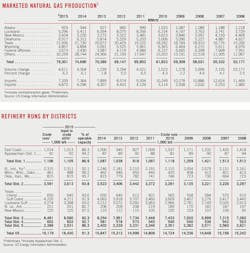
Refining rates high
In 2015, US refiners benefited from falling crude oil prices and robust demand, particularly for gasoline. Product exports also jumped 14% from the year-ago level. Taking advantage of favorable economics, refiners kept utilization high and delayed maintenance.
Crude runs averaged 16.18 million b/d in 2015, up 2.1% from a year earlier. Total input to stills averaged 16.43 million b/d, up 1.7% from the 2014 level. Based on EIA figures for operable capacity of 18 million b/d, the refinery utilization rate for 2015 was 91.3%, compared with 90.4% a year earlier, when operable capacity was pegged at 17.87 million b/d.
During 2015, refinery production rates increased 2.46% for gasoline, 2.36% for jet fuel, and 1.12% for distillate fuel. Residual fuel production declined 3.68%.
According to Muse, Stancil & Co., estimated refining cash margins during 2015 averaged $22.46/bbl for the West Coast, $11.53/bbl for the Gulf Coast, $5.80/bbl for the East Coast, and $18.27/bbl for the Midcontinent. A year earlier, cash margins were $15.04/bbl on the West Coast, $8.50/bbl for the Gulf Coast, $3.99/bbl for the East Coast, and $19.43/bbl for the Midwest.
The average composite cost of crude oil for US refiners during 2015 was estimated at $50.3/bbl, down from $92.22/bbl a year earlier.
For 2016, OGJ projects that crude runs and gross inputs will continue to creep up, while the utilization rate will slip slightly due to higher operable capacity. Crude runs are expected to average 16.2 million b/d. Total inputs will move up 0.3% to 16.48 million b/d, and total operable capacity is forecast to reach 18.15 million b/d this year.
Near-term depressed crude prices combined with still-positive gasoline fundamentals will extend refining prosperity into 2016. Downside risk for the group includes declining US tight oil production and the eventual easing of the crude-price slump.
US gas market
Gas demand from US electric power generation in 2015 increased by 4.15 bcfd, or 19%, relative to 2014, boosted by low gas prices and coal plant retirements. The share of power generation fueled by natural gas increased to 32% last year from 27.3% in 2014, while coal's share decreased to about 34% from 39.3% a year earlier. In 2016, OGJ forecasts that gas demand growth from power generation will ebb due to slower coal retirements.
Commercial and residential demand for gas shows weakness following warmer-than-normal East Coast and Midwest winter weather. Industrial use of gas will increase this year, as new industrial projects, particularly in the fertilizer and chemicals industries, come online.
Collectively, OGJ forecasts that US gas consumption will climb 0.8% this year, following a 4.3% increase last year.
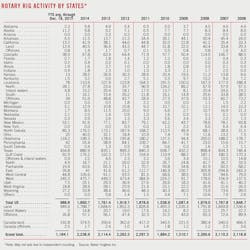
Total marketed production increased 6.2% last year to 29 tcf. OGJ forecasts that marketed production this year will increase 2.4% to 29.7 tcf.
Companies have slashed drilling in the wake of a prolonged period of depressed prices. According to Baker Hughes Inc. data, the overall gas rig count decreased to 168 units by Dec. 18, 2015, from 338 the same period a year ago.
However, increases in drilling efficiency, the backlog of uncompleted wells, and new pipeline capacity will support growing natural gas production in the forecast period, albeit at a much slower pace.
Most of the growth is expected to come from the Marcellus shale. According to estimates from Simmons & Co., new potential takeaway capacity coming online in the Marcellus and nearby Utica shales totals 4.3 bcfd for the second half of 2015 and totals 4.2 bcfd in 2016.
Due to increased domestic production, US imports of gas will fall again this year, by a larger margin than in 2015. Total imports will fall to 2.54 tcf from 2.68 tcf a year earlier, primarily driven by a loss of imports from Canada.
Natural gas exports to Mexico, particularly from the Eagle Ford shale in South Texas, continue to surge because of growing demand from Mexico's electric power industry coupled with flat gas production in Mexico.
LNG gross exports also will increase with the start-up of the Sabine Pass LNG liquefaction plant planned for early 2016. OGJ forecasts that total gas exports will increase 19.7%, following a 17.6% climb in 2015.
US working gas in storage throughout 2015 averaged 2.78 tcf, 23% higher than the 2014 average, with South Central region contributing the most. During the second half of the year, the amount of gas in storage has stayed above the recent 5-year average. On Nov. 20, natural gas working inventories reached a record high of above 4 tcf, according to EIA data.
Natural gas prices are depressed. The average Henry Hub spot price of gas last year sank to an estimated $2.75/MMbtu from $4.44/MMbtu a year earlier. And the average delivered commercial price of gas last year declined 10% from 2014 to average $8/Mcf.