Pipeline test finds Monte Carlo superior to FORM
Mourad Bettayeb
University M'hamed Bougara
Bourmedes, Algeria
Noureddine Abdelbaki
University Akli Mohand Oulhadj
Bouira, Algeria
Mohamed Gaceb
Elahmoune Bouali
University M'hamed Bougara
Bourmedes, Algeria
Pipeline failure probabilities calculated by the Monte Carlo method are better than those given by the first-order reliability method (FORM) but have a longer calculation time.
Shell 92 and RSTRENG codes are less conservative and DNV RP F101 and Modified ASME B31G standards more conservative when calculated reliability is overestimated because the failure probabilities of the latter are smaller. The curve obtained with the Netto-Teixeira formula almost merges with the standard RSTRENG curve as service pressure is increased.
Through the use of structural reliability techniques, this article estimates the failure probability of hydrocarbon transport pipelines in the presence of external corrosion defects. The article applies the FORM method based on the reliability index calculation and the Monte Carlo simulation method to a 26-in. OD, X52-grade steel pipeline.
The choice of the standard used as well as the target failure probability depend on the desired security level and are conditioned by implementation of a more economical maintenance policy by the operator, ensuring better safety and integrity of the works.
Most operating oil and gas pipelines are more than 40 years old and cannot easily be replaced. Repair or rehabilitation of these pipelines requires they undergo an inline inspection to obtain data necessary to assess their status. The interpretation of pipeline inspection results and determining the measures to be taken are important stages of any successful pipeline rehabilitation.
The uncertainty of diagnostic results combined with the potentially wide variation in both the mechanical characteristics of material used during pipeline construction and service pressure suggest use of a probabilistic approach to study pipeline integrity. This article applies a failure probability calculation1 based on structural reliability techniques2 3 such as FORM and second-order reliability methods (SORM) and the Monte Carlo simulation method.
Methodology
Calculating failure probability used mechanical reliability calculation techniques adhering to the following steps:
• Establishing a reliability objective or a decision-making model given by a failure probability or reliability index.
• Formulating a failure criterion in terms of limit-state function given by various standards dealing with corrosion in hydrocarbons transport pipelines.
• Identifying the variables and dominant random parameters in the limit-state functions and specifying their probabilistic distribution, such as geometrical parameters presented by the diameter and WT of each pipeline, the dimensions of the corrosion defects studied, and other parameters related to the applied load such as service pressure and material mechanical properties; e.g. yield and tensile strength.
• Calculating reliability depending on failure mode of the structure or the relevant operation, where the calculation method must consider the form of the limit-state function used and the desired reliability objective.
• Assessing whether the reliability estimated in terms of failure probability and reliability index is sufficient and making the necessary changes.
Choosing the required limit-state function, an important step in calculating reliability, used several international standards: Shell 92, RSTRENG, DNV RP F101, and Modified ASME B31G.4 5 Another researched limit-state function served as a point of comparison.6 7
Reliability, failure probability
Applying probabilistic methods requires formulating failure criterion by limit-state function g via deterministic analysis, which depends on a set of core variables X=(x1,x2,...xn), where variables xi are considered as their uncertainty and variability is taken into account. This limit-state function g({x}), also called performance function in the space of dimension n, separates the physical domain of the admissible situations defined by g({x})>0, representing the field of security from those which are not in the failure domain defined by g({x})<0.
The border between the two domains is a hypersurface limit state characterized by g({x})=0. The safety margin M, corresponding to this limit-state function, is a random variable, usually defined as M=g({x}).
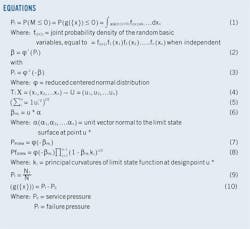
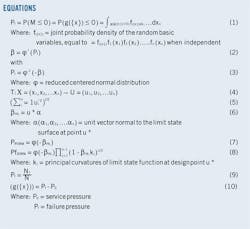
Reliability assessment descriptions8 9 with known density function define failure probability Pf using Equation 1. Equations 2 and 3 define reliability index β for this failure probability.
This assessment of Pf, and therefore β, allows use of several simulation methods including Monte Carlo and FORM-SORM, the latter of which usually handles time calculations for very low failure probabilities.
FORM-SORM
It is possible in many cases today to have a complete description of random vector X (following data collection and probabilistic modeling studies), with the failure probability then calculated through the FORM or SORM method, using the following steps:
• The transformation of basic variables xi into statically independent random normal-centered small variables, ui, turning the basic variables space (including the limit-state function) into a standard normal space (Equation 4).
• In standard normal space, the objective is to determine the design point of the limit-state surface u*=(u1*,.. un*) closest to the origin. It corresponds to reliability index β. In this rotationally symmetric space, it is the most probable failure point, with its coordinates defining the combination of variables most likely to cause failure. Determining this point requires a search process. An iterative algorithm10 solves the problem of minimizing distance, reflecting the limit-state function. Equation 5 describes distance-from-origin.
This scalar quantity, the Hasofer-Lind reliability index, βHL, u*, can also be expressed by Equation 6.
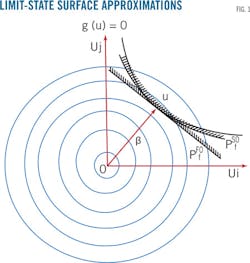
• Once the control point is determined, failure probability can be estimated with the results for the standard normal space. In a first order approximation FORM, therefore, the limit-state surface g(u)=0 in the new space is approached by its hyperplane tangential to the design point. In a second order approximation SORM, a quadratic surface at point u* (Fig. 1) approaches the limit-state surface. Equation 7 (FORM) or 8 (SORM) calculates failure probability.
Monte Carlo
Monte Carlo (MC) uses the fact that the integral (1) can be interpreted as an average value in a stochastic experiment. The mean of a sufficiently large number of independent simulations of this experiment therefore provide an estimate. The process consists of achieving N times random picks of all variables involved in the problem, with the mechanical behavior model represented by g({x}) determining whether there is failure in each case. Equation 9 is the failure probability estimator for Nf failures out of the entire data set.
Case study
A 26-in. OD pipeline of X-52 grade steel subjected to a single internal pressure in the presence of external corrosion defects11 served as the basis for a study of resistance by probabilistic approach (Table 1).
The study applied computational techniques of mechanical reliability to calculate reliability index and failure probability via an already elaborated calculation program12 using the FORM and Monte Carlo simulation methods. Equation 10 is the limit-state function representing the failure criterion of the pipeline in the presence of corrosion defects.13
Results
Table 2 provides the calculation results represented by reliability index β and failure probability Pf, for service pressure Po=5 Mpa, using the FORM method, Monte Carlo, and the Netto-Teixeira formula.
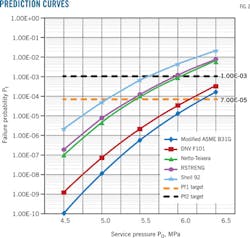
The table shows a variation of in failure probability Pf and the reliability index β from one standard to another. An increase in Pf by the FORM method corresponds to a decrease in the reliability index given by the same method of calculation. Failure probabilities calculated by Monte Carlo are in all cases great in comparison with failure probabilities calculated by FORM and more accurate for small probability values. Fig. 2 displays the Pf variation given by the Monte Carlo method for different operating pressures P0 and for the various standards and formulas used.
Failure probability increases with service pressure. This increase is greater in the case of the DNV RP F101 and Modified ASME B31G standards than when using the others. Larger failure probabilities as given by Shell 92 and RSTRENG than by the Netto-Teixeira formula,6 7 and DNV RP F101 or Modified ASME B31G, the values of which are smaller. This study, however, found the results given by the Netto-Teixeira formula to be nearly identical to those of RSTRENG, especially with the increase in service pressure.
The potentially serious consequences of a pipeline failure require choosing a conservative probability, in this case Pf1=7.10-5.14 This value disallows service pressures of 5.5 and 6 MPa according to the Shell 92 and RSTRENG standards for the case studied. DNV RP F101 and Modified ASME B31G standards, however, authorize these pressures. Only service pressures of 4.5 and 5 MPa are authorized by all standards. Moving to a target failure probability of Pf2=10-3 increases the range of service pressures authorized by all standards to 4.5-5.5 MPa.
Sensibility analysis
With the FORM method a sensitivity analysis of the parameters on the response may supplement the failure probability estimation. Sensitivity factors measure the importance of the random variables involved in the limit-state function, the overall importance of a variable on the calculated probability. This technique allows identifying the concept of importance factor.15
Figs. 3, 4, and 5 show the influence of different random variables given by sensitivity factors, for different service pressures using failure criteria given by the Modified ASME B31G and Shell 92 standards.
An increase in the average values of variables d, L, D, and P0 decreases the pipeline's reliability because they are associated with negative sensitivity factors. An increase in the average values of variables t and specified minimum yield strength (SMYS), however, in the case of Modified ASME B31G, and t and specified minimum tensile strength (SMTS) in the case of Shell 92 corresponds to positive factors and increases the reliability of the pipeline for all the service pressures calculated.
Thickness (t), pressure (P0), and SMYS are the most important variables for Modified ASME B31G and limit of SMTS for Shell 92. Depth of corrosion defect (d), length (L), and pipe diameter, however, are less important for this case study, especially (d), because its average value is not important compared with (t).
For the same operating pressure, sensitivity factors are less important for depth (d), service pressure (P0), and mechanical characteristics (SMYS for Modified ASME B31G) or (SMTS for Shell 92), which explains the smaller failure probability values found for the first case.
For the same failure criterion the sensitivity factors of variables d, L, t, SMYS, and SMTS decrease with pressure increase, while those corresponding to variables D and P0 increase with increased pressure.
References
1. Ahamed, M., "Probabilistic Estimation of Remaining life of a Pipeline in the Presence of Active Corrosion Defects," International Journal of Pressure Vessels and Piping, Vol. 75, No. 4, April 1998, pp. 321-329.
2. Ditlevsen, O., and Madsen, H.O., "Structural Reliability Methods," Department of Mechanical Engineering, Technical University of Denmark, June-September 2007.
3. Sørensen, J.D., "Notes in Structural Reliability Theory And Risk Analysis," Aalborg, February 2004.
4. Cosham. A., and Hopkins, P., "The Pipeline Defect Assessment Manual," IPC02-27067, International Pipeline Conference, Calgary, Sept. 29-Oct. 3, 2002.
5. Bjørnøy, O.H., and Marley, M., "Assessment of Corroded Pipelines: Past, Present and Future," International Conference on Offshore and Polar Engineering, Stavanger, June 17-22, 2001.
6. Netto, T.A., Ferraz, U.S., and Estefen S.F., "The Effect of Corrosion Defects on the Burst Pressure of Pipelines," Journal of Constructional Steel Research, Vol. 61, No. 8, August 2008, pp. 1,185-1,204.
7. Teixeira, A.P., Guedes-Soares, C., Netto, T.A., and Estefen, S.F., "Reliability of Pipelines with Corrosion Defects," International Journal of Pressure Vessels and Piping, Vol. 85, No. 4, April 2008, pp. 228-237.
8. Der Kiureghian, A., Haukaas, T., and Fujimura, K., "Structural Reliability Software at the University of California, Berkeley," Structural Safety, Vol. 28, Nos.1-2, January-February 2006, pp. 44-67.
9. Pitner, P., Riffard, T., and Churier-Bossenec, H.,"Probabilistic Approaches in Fracture Mechanics," EDF-DER 1993.
10. Rackwitz, R., and Fiessler, B., "Structural Reliability Under Combined Load Sequences," Computers & Structures, Vol. 9, No. 5, May 1978, pp. 489-494.
11. Bettayeb, M., Abdelbaki, N., Bouali, E., and Gaceb, M., "Study of the reliability of pipelines containing corrosion defects," International Congress of Chemical and Process Engineering CHISA 2014 & Press 2014, Prague, Aug. 23-27, 2014.
12. Abdelbaki, N., Bouali, E., and Bettayeb, M., "Etude et développement de méthodes appropriées d'amélioration de la sûreté de fonctionnement des installations de transport des hydrocarbures-Rapport final," (French only), PNR National Research Project, December 2013.
13. Mustaffa, Z., Shams, G., and Van Gelder, P.H., A J M. "Evaluating the Characteristics of Marine Pipelines Inspection Data Using Probabilistic Approach," International Probabilistic Workshop, Delft, the Netherlands, Nov. 25-26, 2009.
14. Varfolomeev, I.V., and Yasniy, O.P., "Modeling of Fracture of Cracked Structural Elements with the Use of Probabilistic Methods," Materials Science, Vol. 44, No. 1, January 2008, pp. 87-96.
15. Procaccia, H., and Morilhat, P., "Fiabilité des structures des installations industrielles," (French only), Eyrolles, Paris, 1996.
The authors
Mourad Bettayeb ([email protected]) has worked since 2004 as researcher and assistant professor at the University of Boumerdès Laboratory of Reliability of Hydrocarbon Equipment and Materials. He holds a graduate degree in aeronautic engineering from the University of Blida, Algeria, and went on to earn his European certification (2001) in applied science, advanced solid mechanics, and structures calculation from the University of Liege, Belgium.
Noureddine Abdelbaki ([email protected]) has worked at the University of Boumerdès since 1998 as researcher, dean of oil and chemistry faculty, and director at its Laboratory of Reliability of Hydrocarbon Equipment and Materials. He holds a graduate degree in hydrocarbon engineering from the University of Boumerdès and received a PhD in technical sciences (1988) from the University of Oil and Gas, Moscow.
Mohamed Gaceb ([email protected]) leads a research team at the University of Boumerdès working on materials behavior in technology. From 1986 to 1989 he worked as head of the fracture mechanics subdivision at the Research Centre for Energy Conversion Systems, Algiers. From 1989 to 1998 he was senior lecturer at the University of Blida, supervising masters' students and research projects. He then joined University of Boumerdès as director of a research laboratory. He earned a BS (1980) in mechanical engineering from the University of Sheffield, UK, and his PhD (1985) from Sheffield Hallam University.
Elahmoune Bouali ([email protected]) has worked since 1988 as a researcher and director at the University of Boumerdès' Laboratory of Reliability of Hydrocarbon Equipment and Materials. He holds a graduate degree in hydrocarbon engineering from the University of Boumerdès and received a PhD (1987) in safety of integrity engineering systems from the University of Oil and Gas, Moscow.


