Imbalances weakening oil prices remain in place at start of 2015
Conglin Xu
Senior Editor-Economics
Laura Bell
Statistics Editor
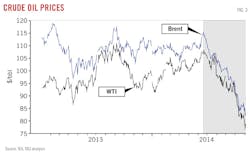
Crude oil prices plunged nearly 50% from June, 2014, to mid-December, driven by fundamental imbalances and market pessimism that remain ominously in place as 2015 begins.
A November decision by the Organization of Petroleum Exporting Countries to leave its production target unchanged at 30 million b/d and to not address actual output left crude prices at the mercy of a market with supply growing faster than demand. Price-restoring balance will have to come from some unpredictable combination of quickened demand growth and production cuts outside OPEC, ministers of which plan no further meetings until June 5.
The path toward an essential rebalancing of the market is riddled with uncertainty.
Economic expansion below forecast levels would further weaken the oil market. Although falling oil prices will boost demand, the effect will be countered by devaluation against the dollar of currencies in oil-importing countries outside the US.
Global oil production in 2015 will depend on how low oil prices go and how long they stay there, which in turn will shape capital investment by oil and gas producers. Output from still economically viable US shale plays is expected to continue growing this year, thanks to increased well productivity and efficiency gains. However, capital spending cuts will reduce drilling and slow the rate of increase.
Supply from OPEC is hard to predict. Motivations vary among members, some of which face immediate fiscal crises from the crude-price plunge while others are better able to endure the revenue shock. Also, Sunni-dominated producers might be content to let falling prices weaken Iran and Russia, both already hurt by international economic sanctions and allied against Sunni regimes in Middle Eastern conflicts. Although Saudi officials reject this view, an easing of regional tensions would shorten the list of reasons Sunni producers have to consider drifting crude prices temporarily advantageous.
Lower oil production growth and improved demand should start to strengthen prices this year. Absent a major disruption to supply, however, the chances are low that oil prices will return soon to the levels they reached last year before beginning their slide.
World economy
Global economic growth in the first half of 2014 was slower than expected, reflecting events in the US, the Euro Zone, Japan, and some large emerging-market economies. Despite setbacks, the world economy continued to recover in the second half of 2014 and is expected to pick up pace in 2015. However, the recovery remains gradual and uneven.
In its most recent World Economic Outlook (WEO), issued in October, the International Monetary Fund (IMF) projected global growth of 3.3% in 2014 and 3.8% in 2015—lower than rates forecast in a July update of its preceding WEO, issued in April.
The US economy gained momentum in recent quarters. The recovery is expected to continue in 2015, supported by improved labor and housing markets and higher consumer confidence. In the UK, economic activity also remains robust, driven by strong domestic demand.
The Organization for Economic Cooperation and Development (OECD) Euro economies are uneven, and growth has only slightly improved. The EU Commission's plan to invest €315 billion in infrastructure over the next 3 years and the European Central Bank's decision to cut interest rates aim to lift growth and inflation and support lending.
The April sales tax increase has continuously impacted the economic development of Japan, turning the country's GDP growth rates negative for 2 consecutive quarters.
For emerging-market economies as a whole, growth is forecast to be 4.4% in 2014 and 5% in 2015, compared with 4.7% in 2013, according to IMF.
Uncertain prospects, capital outflows, and low investment following tensions with Ukraine are weighing on growth in Russia as the ruble loses value.
In China, activity has moderated as a result of weakening investment and tepid domestic demand in a trend recorded since late 2013. Economic sentiment in India has been favorable, in line with a nearly 6% annualized GDP growth in the third quarter of 2014.
Investment remains weak in Brazil, where GDP contracted in 2014. Inflation pressures have intensified.
Worldwide oil demand
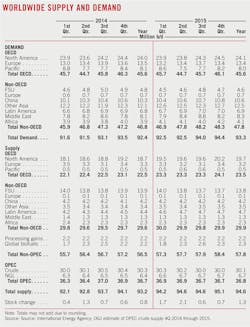
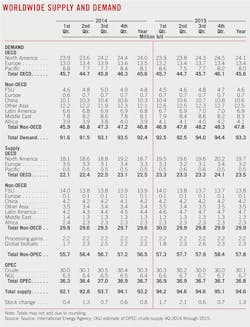
Global oil demand was projected to have increased by 600,000 b/d in 2014, a 5-year low, to an estimated 92.4 million b/d in the December Oil Market Report of the International Energy Agency. The small gain reflects a sharp slowdown in Chinese oil demand growth and steep contractions in Europe and Japan.
The agency's figures indicate that global oil demand will rise in 2015 by 900,000 b/d (or 1%) to 93.3 million b/d. Demand will accelerate in the second half of the year, rising to 94.2 million b/d from 92.5 million b/d in the first half.
Overall, gains in North America and non-OECD economies outside the former Soviet Union are partly offset by declines in the FSU, Europe, and OECD Asia Oceania.
The IEA forecast for OECD oil demand of 45.56 million b/d this year compares with 45.63 million b/d estimated for 2014, 46.06 million b/d in 2013, and 45.92 million b/d in 2012. Ongoing efficiency gains, product switching, and an anemic recovery, with a few exceptions such as the US, have combined to keep OECD oil demand generally declining, as noted by the December IEA report. Japan and Europe are expected to account for much of the projected decline.
Outside the OECD, oil demand will increase 2.1% to 47.8 million b/d this year, IEA said. Last year, non-OECD demand increased 2.4% to 46.8 million b/d. This compares with the average growth during 2009-13 of 3.7%/year. Weaker economic growth in China, Brazil, and Russia; declining currencies of many oil-importing economies relative to the US dollar; and energy subsidy cuts and tax hikes have largely offset the lift to demand from lower oil prices.
In particular, IEA has sharply lowered its forecast for Russian oil demand in 2015 to 3.4 million b/d because of a darker macroeconomic outlook and heightened risks. Total FSU demand is forecast to drop 4.2% to 4.6 million b/d.
Chinese oil demand growth in 2015 will remain muted, increasing to 10.61 million b/d from 10.35 million b/d last year, IEA forecasts, estimating gains of 2.5% for both 2014 and 2015. However, China is still the leading contributor to projected global consumption growth.
Global oil supply
OGJ expects global oil supply in 2015 to continue growing, but the growth rate will be dampened by reduced capital spending and drilling.
If oil prices remain depressed for an extended period, high-cost, long-dated projects will face delays or cancelation due to worsening returns, and exploration and production budgets will be cut further. Vulnerable categories include arctic, deep water, Canadian oil sands, and high-cost unconventional resources, according to a report from Simmons & Co. International.
US drilling this year will decline as budget cuts turn activity away from economically marginal targets. Core areas of many major resource plays are expected to remain active.
International capital spending this year will shrink as well. Large, economically viable major projects already under development will offset declines elsewhere, keeping non-OPEC supply outside the US unchanged or growing slowly. Output from Russian is set to decline due to sanctions and falling oil prices.
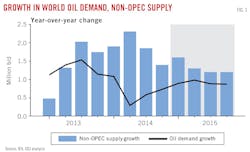
According to IEA's most recent projections, total non-OPEC supply growth will ease from last year's 1.8 million b/d to 1.3 million b/d this year, which is still historically high. In comparison, the US Energy Information Administration (EIA) expects non-OPEC production to grow by 800,000 b/d in 2015, slowing from 2014 growth of 1.9 million b/d, according to its December Short-Term Energy Outlook.
At a Nov. 27 meeting in Vienna, OPEC kept its group production ceiling at 30 million b/d, effective to its next meeting in June, and didn't address output above the target. At the time of writing, OPEC supply had been well above target for two consecutive quarters.
OGJ expects OPEC supply to exceed the implicit need for it in the first half of 2015 but to shift toward better balance in the second half. OPEC crude output will average 30.1 million b/d, down 0.4% from last year, OGJ predicts. NGL output from OPEC members will average 6.7 million b/d, up from 6.4 million b/d last year.
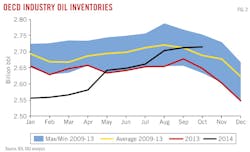
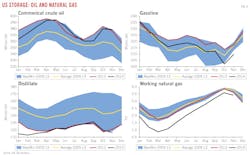
At projected levels of supply and IEA's outlook for demand, inventories will expand by an average of more than 1 million b/d this year. OECD industry inventories built counter-seasonally by 1.4 million bbl last October to stand at 2.72 billion bbl by end month, returning to a surplus against 5-year average levels for the first time since March 2013.
The massive inventory build has raised questions about adequacy of storage capacity, data for which are sparse. IEA estimates that if the build continues, capacity might become strained in the year's second half in OECD Europe and Asia Oceania. Although inventories in OECD North America are near historic highs, storage capacity has expanded to accommodate production growth in the US and Canada (see p. 22).
Crude oil prices
North Sea Brent crude oil spot prices fell by nearly 50% from their 2014 high of $115.19/bbl in June to below $60/bbl in December. WTI spot prices fell correspondingly over the same period, from a peak of $107.95/bbl to $55.96/bbl on Dec. 15.
Continuous growth in US tight oil production, weakness of global oil demand growth, OPEC's unwillingness to cut production, and somber market outlooks are blamed for the price plummet. Actually, negative market sentiment for deterioration of current imbalances might play a role bigger than fundamental demand and supply factors, according to an analysis by OGJ (see sidebar, p. 34).
Price differentials are falling along with prices. The monthly average spread between Brent and WTI spot prices declined to $3.65/bbl in November from $6.01/bbl in June. The differentials between Louisiana Light Sweet crude to these two benchmarks have also narrowed.
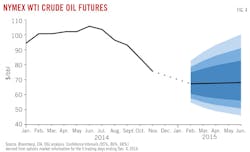
Uncertainty in the price outlook is high, as suggested by the current values of futures and options contracts. The March 2015 WTI futures contract on the New York Mercantile Exchange averaged $67.47/bbl for the 5 days ending Dec. 4, 2014. Implied volatility rose again to average 32%, setting upper and lower limits of 95% confidence interval at $89/bbl and $51/bbl. Last year at this time, WTI for March 2014 delivery averaged $96/bbl, and implied volatility averaged 19%.
By the end of November, the Brent and WTI futures had flipped into contango at the front, when near-term prices are less than long-dated ones, signaling ample supply.
US economic outlook
OGJ forecasts that the US economy, measured by real gross domestic product (GDP), will expand by 2.8% this year. Real GDP growth last year was estimated at 2.2%.
Volatile at the beginning of 2014, the US economy has gained considerable pace in more recent quarters. According to the third estimate by the Bureau of Economic Analysis, real GDP increased at annualized rates of 5% in the third quarter and 4.6% in the second quarter.
The increase in GDP in the third quarter reflected increased consumer spending, nonresidential fixed investment, federal government spending, exports, state and local government spending, and residential fixed investment. Imports, which diminish GDP, decreased.
The unemployment rate remained at 5.8% in November, and nonfarm payrolls grew by 321,000. Existing home sales rose 2.5% in October from a year earlier, according to the Census Bureau.
US economic growth is expected to continue, supported by improved labor and housing markets, household balance sheets, and expenditures. The unemployment rate is expected to remain below 6% in 2015. The drop in fuel prices will also boost consumer spending and reinforce the upswings of industrial production and investment.
The US Federal Reserve announced the end of its bond-buying program in October. Markets are looking ahead to the first hike in US interest rates in years, given the current improvements of the US economy. It is generally expected that the Fed will not raise interest rates before the middle of this year.
Energy demand
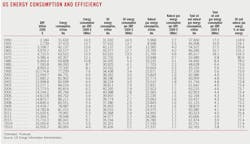
Total US energy consumption will dip 0.1% this year to 98.7 quadrillion btu (quads), OGJ forecasts. This is primarily because of continuing improvements in energy use efficiency and conservation, as well as a normal winter forecast.
Demand for petroleum products this year will rise 0.6% following a year of no growth, driven by economic expansion and lower oil prices. Oil will remain the dominant energy source in the US, holding 36% of the market, up from 35.6% last year.
Gas consumption is set to decline 0.7%, with lower residential and commercial consumption offsetting increases in the electric power and industrial sectors. This compares with a 2.8% increase last year. The natural gas market share will stand at 27.7%, compared with 27.9% in 2014 and 27.4% in 2013.
Estimated coal consumption totaled 18.28 quads in 2014, an increase of 1.1% from 2013, as a result of higher electricity demand and higher power sector natural gas prices. Coal consumption is projected to fall 0.5% in 2015, due to more retirements of coal power plants, and lower natural gas prices.
In 2014, conventional hydropower generation fell 4.4%, while nonhydropower renewables rose 5.1%. Combined, this market segment grew 1.5% in 2014 and is expected to increase 2.3% to 9.65 quads this year, according to OGJ.
US oil market
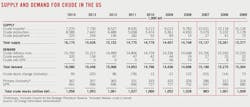
While the first quarter of 2014 saw a 1% increase in total US oil demand, the second and third quarters posted small year-over-year declines. For the year through November, average demand was nearly unchanged from a year earlier at 18.96 million b/d.* Distillates, jet fuel, and gasoline posted the largest gains from a year ago, offsetting sharp declines in demand for residual fuel oil and liquefied petroleum gases (LPG).
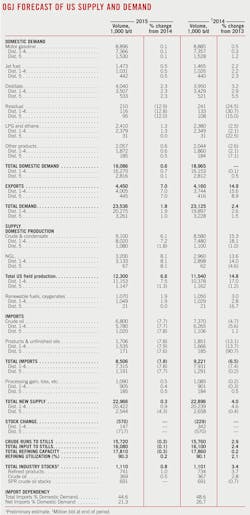
Total US oil demand in 2015 is forecast to grow by 0.6% to 19.086 million b/d, according to OGJ. Demand boosts from economic growth and lower fuel prices will be partly offset by improving vehicle fuel efficiencies and fuel substitution, notably with gas in industrial and residential markets.
US demand for motor gasoline will average 8.896 million b/d in 2015, a 0.1% increase from the 2014 level, as continued improvements in new-vehicle fuel economy offset highway travel growth. Average gasoline demand was 8.84 million b/d in 2013.
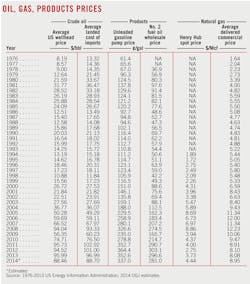
Regular gasoline retail prices fell from a monthly average of $3.69/gal in June to $2.91/gal in November, the first month in which prices average below $3/gal since December 2010, according to EIA figures. The regular gasoline retail price is projected to average $2.59/gal in 2015, down from $3.37/gal in 2014.
Demand for distillate, including heating oil and diesel fuel, increased 3.2% last year to an average of 3.95 million b/d, reflecting cold weather in the first quarter and improved economic activity. Distillate demand will increase 2.3% to an average 4.04 million b/d this year. Diesel fuel prices, which averaged $3.82/gal in 2014, are projected to average $3.07/gal in 2015.
Jet fuel demand increased 2.2% last year to an estimated 1.465 million b/d and is forecast to average 1.473 million b/d in 2015. Jet fuel prices will fall to $2/gal from $2.80/gal last year.
Demand for LPG will increase 2.6% to 2.41 million b/d. Last year LPG consumption averaged 2.35 million b/d, down 4% from 2013. Residual fuel demand is projected to fall 13% to 210,000 b/d this year after falling 24.5% last year.
US oil production
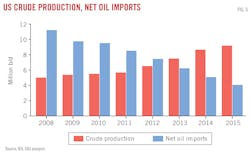
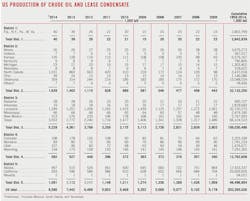
OGJ expects US crude production to average 9.1 million b/d in 2015, up 6.1% from a year earlier. This follows a 15.3% increase in 2014.
EIA expects 2015 US drilling to decline in some areas of both emerging and mature oil production regions, with West Texas Intermediate (WTI) crude oil prices expected to average $58/bbl in the second quarter of 2015.
Producers will readjust their capital budgets and production plans, depending on the magnitude of the oil price decline. Spending will focus on the most productive core areas of major tight oil plays, while high-cost drilling and research drilling in marginal unconventional areas will be reduced.
As stated by EIA, oil prices remain high enough to support development in the Bakken, Eagle Ford, Niobrara, and Permian basin plays, which contribute the majority of US oil production growth. According to a report from the government of North Dakota, most oil production in the Bakken shale play remains profitable at or below $42/bbl.
Notably, greater well productivity, efficiency gains, and reduced cost from service providers will make production growth increasingly resilient.
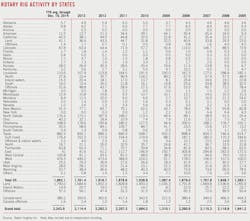
Baker Hughes data, the latest at the time of writing, shows that US oil rigs fell to 1,536 for the week ending Dec. 19 from 1,575 just 2 weeks earlier. The number of rigs in the field remains 141 higher than the previous year.
Gulf of Mexico oil production is expected to continue increasing in 2015 following an 11% increase last year, primarily driven by new projects already under development.
US NGL production will increase 8.1% to 3.2 million b/d this year, OGJ forecasts.
Imports, exports
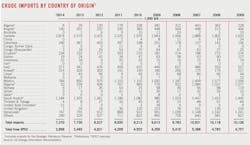
The US will import almost 8% less crude oil and products this year than it did during 2014, averaging 8.5 million b/d, OGJ forecasts. Crude oil imports will average 6.8 million b/d, compared with 7.4 million b/d last year, while imports of petroleum products will fall 7.8% from last year to average 1.7 million b/d.
The leading source of US crude imports in 2014 was Canada, which supplied 2.87 million b/d, 39% of the total. This was followed by crude imports from Saudi Arabia at 1.18 million b/d, Mexico at 784,000 b/d, and Venezuela at 747,000 b/d.
Total crude imports from the OPEC countries averaged 2.86 million b/d last year, 39% of the total. In 2013, crude imports from OPEC averaged 3.49 million b/d.
OGJ forecasts that US exports of crude and products will increase 7% to 4.45 million b/d. This follows a 15% increase last year.
Crude oil exports averaged 320,000 b/d in 2014, the highest level in almost 3 decades. Modest amounts of Canadian crude that were moved through the US for export to Switzerland, Spain, Italy, and Singapore contributed to this increase. The volume is expected to reach 380,000 b/d in 2015.
Growing oil production, limited demand growth, and existing crude export restrictions have made the US a net exporter of refined products. US exports of gasoline, distillates, and other processed oil are forecast to increase to 4 million b/d this year from 3.8 million b/d last year.
In total, imports will supply about 45% of US oil demand this year, down from 48.6% of last year. The share of domestic demand met by net imports will be 21.3%, compared with 26.7% in 2014 and 32.9% in 2013.
US oil inventories
As new supply outweighed oil demand growth, US stocks of commercial crude and products finished 2014 higher than a year earlier. Commercial crude inventories closed out the year up 2.8% at 367 million bbl. Product inventories ended the year at 734 million bbl, up 3.7% from yearend 2013.
Motor gasoline, residual, and distillate inventories at yearend 2014 were down from a year earlier. Inventories of NGL, jet fuel, and unfinished oils finished the year higher.
OGJ expects commercial crude oil and product stocks to finish 2015 at 369 million bbl and 741 million bbl, respectively.
The amount of crude oil in the Strategic Petroleum Reserve (SPR) stood at 691 million bbl at the end of 2014, down from 696 million a year earlier. OGJ expects the SPR to end 2015 at the same level as yearend 2014.
Refining
US refiners are expected to run at a high utilization rate of 90.3% of capacity this year, compared with 90.1% in 2014, according to OGJ. In 2013, the utilization rate was estimated at 88.3%.
Recent refining performance has been supported by strong profitability in areas that benefit from the rapid decline in oil prices and reduced product supply during the fall maintenance period.
Refining cash margins for the 2014 third quarter averaged $19.23/bbl for the Midwest, $16.65/bbl for the West Coast, $8.94/bbl for the Gulf Coast, and $5.68/bbl for the East Coast, according to Muse Stancil & Co. Average cash refining margins for these refining centers averaged $17.67/bbl, $13.87/bbl, $6.55/bbl and $1.89/bbl, respectively, in the previous year's third quarter.
The average composite cost of crude oil for US refiners in the third quarter of 2014 was $96.30/bbl, down 8.4% from a year earlier, according to EIA.
In 2015, US refiners will keep their cost advantage over their European peers, with beneficial crude sourcing and cheap natural gas. However, crude differentials and product margins will tighten gradually as a lagged result of low oil prices, hampering profits of refiners.
Natural gas market
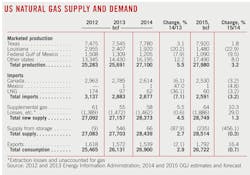
OGJ forecasts US natural gas consumption will drop 0.7% this year to 26.7 tcf, following an estimated increase of 2.9% in 2014.
Natural gas consumption in the electric power and industrial sectors will increase this year as a result of lower projected prices, economic growth, and the retirement of coal plants. However, lower residential and commercial consumption, supported by a modest weather forecast, is expected to offset increases in the power and industrial sectors.
US marketed production of natural gas is expected to increase 3.2% this year to 27.98 tcf, given record levels of current production driven by the Marcellus-Utica shale region. Total US marketed gas production in 2014 increased 5.5% to 27.1 tcf from a year earlier.
Production of natural gas in the Marcellus region, the largest natural gas producing region, reached a record high of nearly 15.9 bcfd in November, up 17.9% from a year earlier and 74% from November 2012, according to the American Petroleum Institute.
Gas production from federal Gulf of Mexico leases continues a long-term decline, falling 8% in 2014 and an expected 9.5% this year.
Gas imports from Canada are forecast to shrink 3.2% this year to 2.53 tcf as a result of growing domestic production. This follows an estimated decline of 6.1% last year. OGJ forecasts that the US will import 60 bcf of LNG, 3.2% less than a year ago.
Estimated gas exports in 2014 declined 2.1%, mainly because of shrinking pipeline exports to Canada. In contrast, pipeline exports to Mexico and LNG exports both increased last year.
Exports to Mexico, particularly from the Eagle Ford shale, are expected to continue growing this year because of higher demand from Mexico's electric power sector and flat Mexican production. LNG exports from the US Lower 48 will start when Cheniere Energy's liquefaction plant on Sabine Pass in Cameron Parish, La., begins service, likely late this year.
Natural gas storage levels fell sharply in early 2014 because of extremely cold weather and remained at or below the 5-year minimum level until recently. After a strong injection season since April, gas inventories for the Lower 48 states totaled 3.29 tcf as of Dec. 12, 2014, slightly above 2013 levels for the first time of the year.
The Henry Hub natural gas spot price averaged $4.44/MMbtu in 2014, compared with $3.37/MMbtu in 2013 and $2.75/MMbtu in 2012. The average Henry Hub gas price in 2015 is projected to fall below $4/MMbtu. The gas futures price for March 2015 delivery recently averaged $3.84/MMbtu.
* EIA revised up its estimate for US 2013 oil consumption to 18.96 million b/d in the December STEO from 18.89 million b/d in its June STEO.
