Crude oil pipeline growth, revenues surge; construction costs mount

US pipeline operators continued to expand their systems rapidly in 2013. Investment in oil pipeline carrier property surged last year, rising roughly $14 billion to more than double the values seen only 7 years before.
But while oil pipeline operators' revenues also surged, lifting net incomes with them, revenue growth for natural gas line operators remained relatively anemic and incomes fell for a third straight year. Gas pipeline operators scaled back planned mileage additions, focusing instead on looping existing systems and adding compression to boost capacity.
Rapidly rising pipeline construction cost-up 60% year-on-year and more than twice what they were only 2 years earlier-likely also moved gas pipeline operators away from adding significant mileage. Compression costs, by comparison, only increased 10% from 2012, not being subject to the spectacular rises in labor and contingency costs seen in pipeline construction.
Details
Oil pipeline operators' revenues jumped another 12% in 2013, allowing carriers to continue rapid expansion of their properties while yet again pocketing record profits. Natural gas pipeline operators, meanwhile, saw net income slide while they added 38% to their combined gas plant.
Oil pipeline operators' net income reached an all-time high of nearly $7 billion, an 8.7% increase from 2012. With revenue rising even more rapidly, however, the resulting earnings as a percent of revenue continued to ease from the record levels seen in 2011 to 44.37% last year. The disparity between income and revenue coincided with a more than doubling in the expansion rate of carrier property, as companies accelerated their infrastructural build-out.
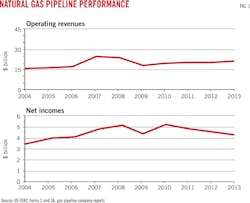
Natural gas pipeline operators meanwhile saw the erosion of their profits accelerate, falling nearly 10% to $4.3 billion, the lowest level since 2006 despite revenues rising 1.45% (Fig. 1).
Proposed newbuild natural gas mileage was less than two-thirds of 2013's announced build, while planned horsepower additions of 705,604 hp were 157% of 2013's total.
Labor remained the most expensive construction component but was only marginally more costly per mile than the miscellaneous costs category of which contingencies make up a large part.
Estimated $/mile land pipeline construction costs rose more than $2.5 million (60%) to $6.57 million. Pipeline labor prices remained the single most expensive per-mile item at $2.8 million/mile, but the biggest single increase was in miscellaneous costs, which rose 75% to $2.5 million/mile. Material costs were the only category to ease, though only marginally, slipping less than $60,000/mile to $894,139/mile.
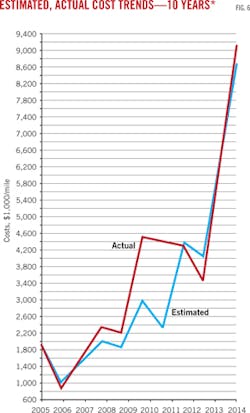
Estimated land pipeline construction costs for projects completed in the 12 months ending June 30, 2014, were roughly $500,000/mile less than actual costs, most of the difference coming from labor costs more than $750,000/mile lower than anticipated. Actual compressor station costs were about equal to estimated costs for projects completed by June 30, 2014.
US pipeline data
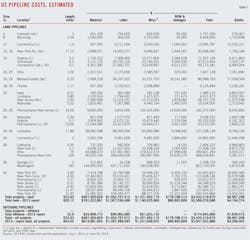
At the end of this article, two large tables (beginning on p. 126) offer a variety of data for US oil and gas pipeline companies: revenue, income, volumes transported, miles operated, and investments in physical plants. These data are from annual reports filed with the US Federal Energy Regulatory Commission by regulated oil and natural gas pipeline companies for the previous calendar year.
Data are also from periodic filings with FERC by those regulated natural gas pipeline companies seeking FERC approval to expand capacity. Oil & Gas Journal keeps a record of these filings for each 12-month period ending June 30.
Combined, these data allow an analysis of the US regulated interstate pipeline system.
• Annual reports. Companies that, in FERC's determination, are involved in interstate movement of oil or natural gas for a fee are jurisdictional to FERC, must apply to FERC for approval of transportation rates, and therefore must file a FERC annual report: Form 2 or 2A, respectively, for major or nonmajor natural gas pipelines; Form 6 for oil (crude or product) pipelines.
The distinction between "major" and "nonmajor" is defined by FERC and appears as a note at the end of the table listing all FERC-regulated natural gas pipeline companies for 2013 at the end of this article.
The deadline to file these reports each year is Apr. 1. For a variety of reasons, a number of companies miss that deadline and apply for extensions, but eventually file an annual report. That deadline and the numerous delayed filings explain why publication of this OGJ report on pipeline economics occurs later in each year. Earlier publication would exclude many companies' information.
• Periodic reports. When a FERC-regulated natural gas pipeline company wants to modify its system, it must apply for a "certificate of public convenience and necessity." This filing must explain in detail the planned construction, justify it, and-except in certain instances-specify what the company estimates construction will cost.
Not all applications are approved. Not all that are approved are built. But, assuming a company receives its certificate and builds its facilities, it must-again, with some exceptions-report back to FERC how its original cost estimates compared with what it actually spent.
OGJ spends the year July 1 to June 30 monitoring these filings, collecting them, and analyzing their numbers.
OGJ's exclusive, annual Pipeline Economics Report began tracking volumes of gas transported for a fee by major interstate pipelines for 1987 (OGJ, Nov. 28, 1988, p. 33) as pipelines moved gradually after 1984 from owning the gas they moved to mostly providing transportation services.
Volumes of natural gas sold by pipelines have been steadily declining, so that, beginning with 2001 data in the 2002 report, the table only lists volumes transported for others.
The company tables also reflect asset consolidation and mergers among companies in their efforts to improve transportation efficiencies and bottom lines.
Reporting changes
The number of companies required to file annual reports with FERC may change from year-to-year, with some companies becoming jurisdictional, others nonjurisdictional, and still others merging or being consolidated out of existence.
Such changes require care be taken in comparing annual US petroleum and natural gas pipeline statistics.
Institution by FERC of the two-tiered (2 and 2A) classification system for natural gas pipeline companies after 1984 further complicated comparisons (OGJ, Nov. 25, 1985, p. 55).
Only major gas pipelines are required to file miles operated in a given year. The other companies may indicate miles operated but are not specifically required to do so.
For several years after 1984, many non-majors did not describe their systems. But filing descriptions of their systems has become standard, and most provide miles operated.
Reports for 2013 show a decrease in FERC-defined major gas pipeline companies: 92 companies of 163 filing for 2013, from 93 of 162 for 2012.
FERC made an additional change to reporting requirements for 1995 for both crude oil and petroleum products pipelines. Exempt from requirements to prepare and file a Form 6 were those pipelines with operating revenues at or less than $350,000 for each of the 3 preceding calendar years. These companies must file only an "Annual Cost of Service Based Analysis Schedule," which provides only total annual cost of service, actual operating revenues, and total throughput in both deliveries and barrel-miles.
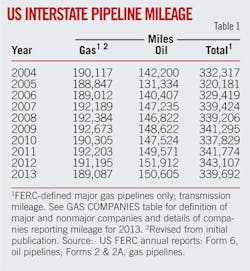
In 1996 major natural gas pipeline companies were no longer required to report miles of gathering and storage systems separately from transmission. Thus, total miles operated for gas pipelines consist almost entirely of transmission mileage.
FERC-regulated major natural gas pipeline mileage fell in 2013 (Table 1) by 2,108 miles, or 1.1%.
Rankings; activity
Natural gas pipeline companies in 2013 saw operating revenues rise by more than $303 million or roughly 1.5% from 2012, continuing the gains seen the past few years. Net incomes, however, fell more than $462 million (nearly 10%), continuing the trend begun in 2011.
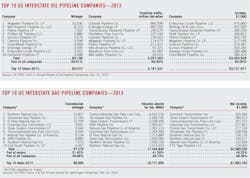
Oil pipelines fared better, with earnings rising more than $557 million (8.7%) on the back of a more than $1.7 billion (12.3%) increase in revenues (Table 2). Crude deliveries for 2013 increased by almost 651 million bbl or 8.7%, while product deliveries fell 194 million bbl (2.9%).

OGJ uses the FERC annual report data to rank the top 10 pipeline companies in three categories (miles operated, trunkline traffic, and operating income) for oil pipeline companies and three categories (miles operated, gas transported for others, and net income) for natural gas pipeline companies.
Positions in these rankings shift year to year, reflecting normal fluctuations in companies' activities and fortunes. But also, because these companies comprise such a large portion of their respective groups, the listings provide snapshots of overall industry trends and events.
For instance, the growth in oil pipeline earnings runs against the top 10 companies in the segment, for which combined income eased more than $220 million, suggesting an increased role of smaller companies in this particular transport segment. The top 10 companies' share of the segment's total earnings was roughly 50% in 2013, compared with 58% a year earlier.
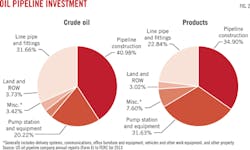
Net income as a portion of natural gas pipeline operating revenues slipped to 20.22% in 2013, continuing the fall from the record highs seen in 2010 to the lowest levels seen in more than 10 years. The percentage of income as operating revenues for oil pipelines continued to slide from its own 2011 record of 48.63%, reaching 44.37% in 2013, but remained well above 2010 levels.
Net income as a portion of gas-plant investment slipped to 2.93%, the lowest level in at least 17 years. Net income as a portion of investment in oil pipeline carrier property eased to 10.3% from 11.9% in 2012. Income as part of investment in carrier property in 2004 stood at 11.4%, having risen steadily toward that level from 6.8% in 1998.
Major and nonmajor natural gas pipelines in 2013 reported an industry gas-plant investment of roughly $146.7 billion, the highest levels ever, up from more than $142 in 2012, $138.6 billion in 2011, $124.7 billion in 2010, almost $121.3 billion in 2009, nearly $105.8 billion in 2008, $95.5 billion in 2007, and $88.3 billion in 2006.
Investment in oil pipeline carrier property surged in 2013, to more than double the values seen only 7 years earlier, reaching nearly $68 billion after climbing above $54 billion in 2012, hitting roughly $49.2 billion in 2011, almost $45.4 billion in 2010, $41.6 billion in 2009, $39.1 billion in 2008, almost $35.9 billion in 2007, and beginning its current upward momentum in 2006, moving to $32.7 billion from the lowest level seen since at least 1997, $29.5 billion in 2005.
OGJ for many years has tracked carrier-property investment by five crude oil pipeline and five products pipeline companies chosen as representative in terms of physical systems and expenditures (Table 3). In 2003, we added the base carrier-property investment to allow for comparisons among the anonymous companies.
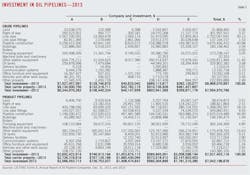
The five crude oil pipeline companies in 2013 increased their overall investment in carrier property by more than $1.4 billion (18.7%), accelerating the smaller gains seen in 2012 and 2011 and reflecting the activity seen in the segment as a whole. All of the companies increased investment in carrier property.
The five products pipeline companies also saw their overall investment in carrier property accelerate in 2013, adding more than $478 million, or 6.8%, with all companies increasing their investment here as well.
Comparisons of data in Table 3 with previous years' must be done with caution as mergers, acquisitions, and sales can make comparisons with previous years' data difficult.
Fig. 2 illustrates the investment split in the crude oil and products pipeline companies.
Construction mixed
Applications to FERC by regulated interstate natural gas pipeline companies to modify certain systems must, except in certain instances, provide estimated costs of these modifications in varying degrees of details.
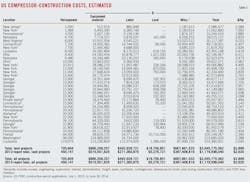
Tracking the mileage and compression horsepower applied for and the estimated costs can indicate levels of construction activity over 2-4 years. Tables 4 and 5 show companies' estimates during the period July 1, 2013, to June 30, 2014, for what it will cost to construct a pipeline or install new or additional compression.
These tables cover a variety of locations, pipeline sizes, and compressor-horsepower ratings.
Not all projects proposed are approved. And not all projects approved are eventually built.
Applications filed in the 12 months ending June 30, 2014, fell after jumping last year.
• Nearly 523 miles of pipeline were proposed for land construction, and no new offshore work was submitted. The land level was down from the 820 miles proposed for land construction in 2013, a sharp rebound from the 144 miles of pipeline proposed for land construction in 2012. All fall short of the recent peak of 2,180 miles proposed for construction in 2009, the highest level since more than 2,700 miles were proposed in 1998.
• New or additional compression proposed by the end of June 2014 measured nearly 706,000 hp, up from the more than 450,000 hp proposed the year before, the 184,000 hp proposed in 2012, and eclipsing and the 664,775 hp proposed in 2009.
Putting the uptick in US gas pipeline construction in perspective, Table 4 lists 31 land-pipeline "spreads," or mileage segments, compared with:
• 26 land and 2 marine projects (OGJ, Sept. 2, 2013, p. 117).
• 11 land and 0 marine projects (OGJ, Sept. 3, 2012, p. 118).
• 31 land and 0 marine projects (OGJ, Sept. 5, 2011, p. 97).
• 8 land and 0 marine projects (OGJ, Nov. 1, 2010, p. 108).
• 21 land and 0 marine projects (OGJ, Sept. 14, 2009, p. 66).
• 19 land and 0 marine projects (OGJ, Sept. 1, 2008, p. 58)
• 25 land and 1 marine project (OGJ, Sept. 3, 2007, p. 51)
• 42 land and 1 marine project (OGJ, Sept. 11, 2006, p. 46).
• 56 land and 4 marine projects (OGJ, Sept. 12, 2005, p. 50).
All but three of the spreads in 2014 measured 23 miles or less, suggesting an emphasis on looping existing transmission infrastructure and building laterals rather than building new large transmission lines, particularly with 24 of the total coming in under 15 miles, and 14 at less than 5 miles.
For the 12 months ending June 30, 2014, the 31 land projects would cost an estimated $3.43 billion, compared with $3.37 billion for 26 projects a year earlier.
It is helpful to remember that these statistics cover only FERC-regulated pipelines. Many other pipeline construction projects were announced in the 12 months ending June 30, 2014, but as mentioned earlier, many of these projects involved connecting developing natural gas shale plays such as Eagle Ford and Marcellus to already operating transportation infrastructure and may have fallen outside of FERC's jurisdiction.
A report conducted in March on behalf of the Interstate Natural Gas Association of America concluded that the US and Canada will require annual average midstream natural gas, crude oil, and NGL infrastructure investment of $30 billion/year, or $641 billion (in real 2012 dollars) total, over the 22-year period 2014-35 to accommodate new supplies, particularly from the prolific shale plays, and growing demand for gas in the power-generation sector.
Included in the $30 billion/year are:
• $10 billion/year for new oil and gas lease equipment.
• Nearly $9 billion/year for expanded gas and liquids mainline capacity.
• More than $3 billion/year for new oil and gas gathering lines.
• More than $2 billion/year for new laterals.
• Roughly $2 billion/year for new LNG export plants.
The report also forecasts the need for about 850 miles/year of new gas transmission mainline, more than 800 miles/year in new natural gas laterals to-from power plants, processing plants, and storage fields, almost 700 miles/year of new NGL transmission line, and more than 730 miles/year in new oil transmission line.1
Against the backdrop, estimated $/mile costs for new projects as filed by operators with FERC soared from recent levels. For proposed onshore US gas pipeline projects in 2013-14, the average cost was $6.6 million/mile, more than twice what it was only 2 years earlier. In 2012-13, the average cost was $4.1 million/mile, compared with $3.1 million/mile in 2011-12; $4.4 million/mile in 2010-11; $5.1 million/mile in 2009-10; $3.7 million/mile in 2008-09; $3.4 million/mile in 2007-08; and $2.8 million/mile in 2006-07.
Cost components
Variations over time in the four major categories of pipeline construction costs-material, labor, miscellaneous, and right-of-way (ROW)-can also suggest trends within each group.
Materials can include line pipe, pipe coating, and cathodic protection.
"Miscellaneous" costs generally cover surveying, engineering, supervision, contingencies, telecommunications equipment, freight, taxes, allowances for funds used during construction (AFUDC), administration and overheads, and regulatory filing fees.
ROW costs include obtaining rights-of-way and allowing for damages.
For the 32 land spreads filed for in 2013-14, cost-per-mile projections rose in all categories except material. In 2011 miscellaneous charges actually passed material to become the second largest cost category, and it retained this position through 2014:
• Material-$894,139/mile, down from $952,328/mile for 2012-13.
• Labor-$2,781,619/mile, up from $1,594,323/mile for 2012-13.
• Miscellaneous-$2,547,600/mile, up from $1,451,770/mile for 2012-13.
• ROW and damages-$343,850/mile, up from $105,943/mile for 2012-13.
The continued rise in miscellaneous costs was driven by companies increasing the amount set aside for contingencies in their estimates.
Table 4 lists proposed pipelines in order of increasing size (OD) and increasing lengths within each size.
The average cost-per-mile for the projects rarely shows clear-cut trends related to either length or geographic area. In general, however, the cost-per-mile within a given diameter decreases as the number of miles rises. Lines built nearer populated areas also tend to have higher unit costs.
Additionally, road, highway, river or channel crossings, and marshy or rocky terrain each strongly affect pipeline construction costs.
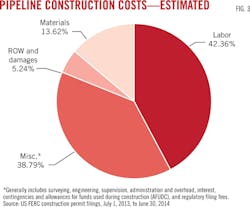
Fig. 3, derived from Table 4, shows the major cost-component splits for pipeline construction costs.
Labor costs fell as a portion of land construction costs, but remained the single most expensive category. Labor's portion of estimated costs for land pipelines rose to 42.36% in 2014 from 38.84% in 2013, 44.61% in 2012, 44.27% in 2011, 44.61% in 2010, 37.95% in 2009, and 39.76% in 2008. Material costs for land pipelines saw its share of total costs plunge to 13.6% in 2014, from 23.2% in 2013, 15.99% in 2012, and 14.54% in 2011.
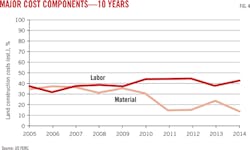
Fig. 4 plots a 10-year comparison of land-construction unit costs for the two major components, material and labor.
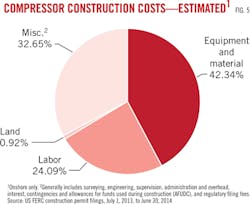
Fig. 5 shows the cost split for land compressor stations based on data in Table 5.
Table 6 lists 10 years of unit land-construction costs for natural gas pipelines with diameters ranging from 8 to 36 in. The table's data consist of estimated costs filed under CP dockets with FERC, the same data shown in Tables 4 and 5.

Table 6 shows that the average cost per mile for any given diameter may fluctuate year to year as projects' costs are affected by geographic location, terrain, population density, or other factors.
Completed projects' costs
In most instances, a natural gas pipeline company must file with FERC what it has actually spent on an approved and built project. This filing must occur within 6 months after the pipeline's successful hydrostatic testing or the compressor's being put in service.
Fig. 6 shows 10 years of estimated vs. actual costs on cost-per-mile bases for project totals.
Tables 7 and 8 show actual costs for pipeline and compressor projects reported to FERC during the 12 months ending June 30, 2014. Fig. 7, for the same period, depicts how total actual costs ($/mile) for each category compare with estimated costs.

Actual labor costs for pipeline construction were more than $750,000/mile lower than estimated costs for the same projects. Overall actual costs were 5.5% lower than projected costs for the 12 months ending June 30, 2014, despite higher material and miscellaneous costs.

Some of these projects may have been proposed and even approved much earlier than the 1-year survey period. Others may have been filed for, approved, and built during the survey period.
If a project was reported in construction spreads in its initial filing, that's how projects are broken out in Table 4. Completed projects' cost data, however, are typically reported to FERC for an entire filing, usually but not always separating pipeline from compressor-station (or metering site) costs and lumping various diameters together.
The 12 months ending June 30, 2014, saw more than 147,000 hp of new or additional compression completed, roughly flat with 143,000 hp the year before. Actual compression costs were just $59/hp (2.2%) higher than estimates (Table 8).

Reference
1. ICF International, "North America Midstream Infrastructure Through 2035; Capitalizing on Our Energy Abundance," Mar. 17, 2014.
Click here to view the PDF of the "Gas Pipeline Companies"
About the Author

Christopher E. Smith
Editor in Chief
Chris joined Oil & Gas Journal in 2005 as Pipeline Editor, having already worked for more than a decade in a variety of oil and gas industry analysis and reporting roles. He became editor-in-chief in 2019 and head of content in 2025.