Abandoned gulf reservoirs provide low cost, low risk prospects
John D. Grace
Scott Morris
Tony Dupont
Earth Science Associates
Long Beach, Calif.
Production growth of onshore unconventional oil and gas and of deepwater oil has headlined a fundamental change in US hydrocarbon supply in the last 6 years. Nevertheless, while continuing to increase, both sources face cost and regulatory obstacles to maintaining growth of output at recent rates.
New resources in established fields can provide a low-cost, less regulated complement to existing supplies as well as opportunities for niche producers and particularly for companies that own leases under which most of these accumulations are located.
A study by Earth Science Associates (ESA), based on decline curve analysis of 59,025 completions and 27,328 reservoirs, located and evaluated all abandoned high-graded accumulations that would be attractive today. Additional "data-mining" analyses of well test records and 35 years of independent reserve estimates for all fields and sands in the US Gulf of Mexico, made by the US Minerals Management Service and the Bureau of Ocean Energy Management (BOEM), identified further prospects for new production.
The study required development of automated batch estimation of tens of thousands of decline curves, statistical identification of large breaks in production data to refine decline curve estimates, and machine processing operator-assigned reservoir names to define reservoirs usable in the analysis. These techniques were also applied to finding discovered sands that slipped from inventory and promising completions that never produced. Both time series and spatial analytic techniques were focused on mining the government's reserve histories of the gulf's fields and sands.
The heavy computing was done in R, an open-source statistical package; the spatial analysis and integration of input data and outputs were accomplished in ESA's GOM3 system, which is the industry standard for geographic information systems (GIS) in the gulf and is written on the Environmental Systems Research Institute's ArcGIS platform. The Forgotten Oil and Gas study only targeted reservoirs abandoned before 2010 using data publically released by BOEM.
The study generated more than 2,000 major leads-all within the bounds of producing or abandoned fields in the gulf. These were filtered out of databases with up to 7 million records, identifying five key types of opportunities:
• More than 500 shut-in oil reservoirs with more than 100,000 bbl of recoverable oil remaining and 29 with more than 1 million bbl estimated by decline curve analysis. For gas reservoirs, decline curves show more than 1,400 reservoirs with more than 1 bcf remaining and 57 with more than 10 bcf.
• Hundreds of reservoirs shut-in before production began to decline and whose final production rates were higher than the average for today's online reservoirs.
• More than 100 completions with prospective initial test rates that never produced.
• Dozens of fields for which the BOEM wrote down large reserves in the past but some of which represent possibly profitable targets at today's prices, costs, and technological proficiency.
• A dozen sands booked by the BOEM on initial discovery but never produced and were subsequently removed from the government's inventory of accumulations.
Batch decline curve analysis
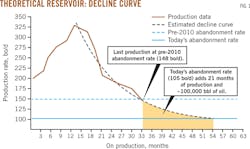
J.J. Arps formalized most of the mathematical foundations and practice of decline curve analysis in petroleum engineering in 1945.1 The basic principle is that, after production peaks, future output can be forecast by the rate at which post-peak production declines. Engineers plotted production rates vs. time (or cumulative production) and drafted a line best fitting the data using a straight edge from the peak through the last production observation.
The engineer could then predict future output by extending this line. Remaining producible volumes could be calculated from the predicted production rates (Fig. 1).
Eventually, computers replaced drafting to determine decline curves. Today, engineering software estimates four mathematical classes of decline models:
• Exponential functions of production rate vs. time.
• Hyperbolic functions of production rate vs. time.
• A linear model of rate vs. cumulative production.
• For gas wells, adjusted pressure (P/Z) vs. cumulative production.
Because of insufficient pressure data for the gulf, the P/Z model could not be run in the study.
Typically, estimation is deterministically reported, not including confidence intervals on either future production or remaining resources. Also, decline curve analysis is almost always run by an engineer studying one well or reservoir at a time.
The objective of the study, however, was to estimate tens of thousands of decline curves and quantitatively evaluate the statistical confidence in the results of each. The algorithm for batch analysis estimated the three alternative models for each reservoir and then determined which curve was the best fit statistically. The study also accommodates a major problem engineers face when performing decline analysis on individual wells-breaks in production.
Most wells experience occasional unusual drops in output or are temporarily shut-in; sometimes this has little effect on the overall decline. More commonly, an engineer must adjust the decline curve, often starting the analysis after the break in production (i.e., a significant change in slope). Processing tens of thousands of production histories required finding these breaks automatically and adjusting the starting (peak) point of the decline analysis as necessary. A typical run for all reservoirs in the gulf takes about 48 hr.
Preparing decline analysis data
Before running the decline curve algorithm, we first had to aggregate completions into reservoirs. Once this step was completed, the study then determined abandonment rates for each reservoir before 2010 while comparing it with current abandonment rates given today's technical and economic climate.
The study found that production from 78% of all gulf reservoirs required only one completion. The balance (22% of gulf reservoirs) required multiple completions. For the latter, we used a sum of the monthly oil, gas, and water from each completion to obtain a production profile for the entire reservoir.
If the productive intervals in every well were consistently named, aggregation would be simple. Unfortunately, inconsistencies arise from different practices among operators, idiosyncratic hand recording, and simple entry errors. In the easiest cases, a completion in the "A1" reservoir needs to be joined to completions labelled "A-1," "A 1," and "A/1." To check the reliability of these reassignments, we required that all completions grouped into a single reservoir be within specific lateral and vertical distances of each other.
Abandonment rates
The production rate at which interesting reservoirs were abandoned many years ago must be greater than the rate at which the same reservoir would be abandoned today.
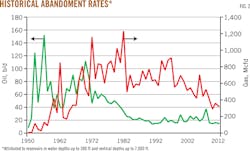
Average abandonment rates for similar reservoirs have fallen (Fig. 2). Some of this change is due to higher prices, some to improved technology that has lowered costs and made it profitable to flow wells to lower rates. Additionally, infrastructure on the gulf shelf has become denser, which lowers production and transport costs today. On the other hand, water depths and total vertical depths (TVDs) have increased. Higher marginal and average costs of production for those wells have boosted minimum flow rates at which they are abandoned.
To estimate current abandonment rates, we conducted a separate study of the 2,065 gulf reservoirs shut-in between 2010-12. These newly shut-in reservoirs were placed in a matrix based on ranges of GOR, water depth, and reservoir TVD. This control group allowed us to compare the final production rate of each reservoir shut-in before 2010 with the final rates from the 2010-12 set that shared similar GOR, water depth, and reservoir TVD.
With the best-fitting decline model from each reservoir shut-in before 2010 and an estimate of the production rate at which it would be shut-in today, we calculated the remaining producible oil and gas, along with 10-90% confidence intervals on that estimate. Additionally, for each reservoir analyzed, we reported statistics describing the best fit of each regression model for assessment of the quality of the forecasts.
Finding forgotten reserves
Ignoring statistical confidence and minimum volumes remaining in each of the 27,328 reservoirs, the decline curve analysis found 2.81 billion boe of remaining producible oil and gas. That number, however, must be immediately cut to eliminate estimates made by statistically unreliable regression models of decline.
With a common measure for statistical quality, called R2, to eliminate bad regressions (i.e., R2less than 0.6), a smaller but still impressive volume of forgotten resources remained-304 million bbl of oil and 6.6 tcf of gas (or a total of 1.47 billion boe). The analysis that follows includes only decline curves with statistical fits carrying R2 greater than 0.6.
Although these are large volumes in aggregate, what is attractive to producers are the very largest accumulations in these distributions. On the oil side, with minimum interesting reservoir size set at 100,000 bbl recoverable, 556 oil accumulations were found; with the minimum raised to 1 million bbl, 29 reservoirs made the grade, the largest of which was 10.2 million bbl. For gas, setting the minimum size to 1 bcf, 1,417 reservoirs met that threshold and 57 contained at least 10 bcf, the largest of which was 67.4 bcf.
While 100,000 bbl of oil and 1 bcf of gas may seem low thresholds, these equal the decadal median sizes of new oil and gas reservoirs brought online in the gulf within the last 40 years.
Fig. 3 shows box-and-whisker plots of the size distribution of oil (left) and gas (right) reservoirs brought online by decade in the gulf. The dark horizontal lines in the middle of the boxes reflect the median reservoir size, the upper and lower bounds of the boxes are the bottom of the second quartile and top of the third quartile respectively of the size distributions. The ends of the whiskers are set at 1.5 times the sizes represented by the tops and bottoms of the boxes (the interquartile range). The blue dashed line in each plot shows the minimum thresholds used for potentially prospective reservoirs identified in this study (100,000 bbls of oil and 1 bcf of gas respectively).
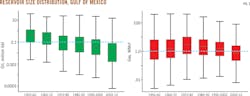
It is true that the "anchoring" (i.e., largest) reservoirs of new field discoveries are larger than these medians. Over the last 40 years, however, half of the new reservoir additions within discovered fields have fallen between 10,000 and 226,000 bbl of oil and 500 MMcf and 6 bcf for gas.
These are comparable to the ranges of most remaining recoverable volumes of the 556 oil and 1,417 gas reservoirs highlighted in the study. The reservoirs assessed in the study between 100,000 and less than 1 million bbl contain 127 million bbl collectively; for gas reservoirs between 1 and less than 10 bcf, 3.1 tcf was found. At the richest ends of both distributions, the 29 oil accumulations greater than 1 million bbl hold 65.9 million bbl collectively and the 57 gas reservoirs with remaining recoverable greater than 10 bcf have 1.1 tcf.
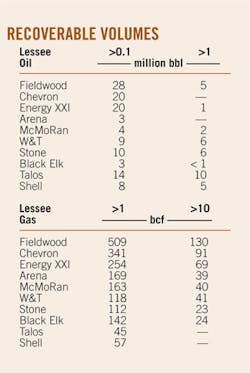
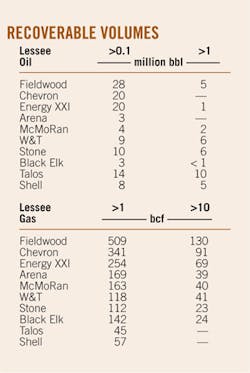
By joining the reservoirs identified in the study with the leases in which they are contained and allocating the volumes to lessees by their percent ownership of those leases, we determined the companies holding the greatest volumes of forgotten oil and gas (table). About 30% of the resources in reservoirs greater than 100,000 bbl and greater than 1 bcf are under currently open lease blocks.
Shut-in before decline
For all reservoirs shut-in before 2010, about 7% of oil reservoirs and 6% of gas reservoirs were abandoned before their production began to decline. To be fair, most of them were not increasing when turned off. These reservoirs made small volumes monthly and at some point, operators judged them uneconomic and abandoned them.
Some, however, did exhibit positive production profiles. More importantly, hundreds had final output (averaging the final 2 months) higher than the average daily rate for reservoirs on line in the 2010-12 control period. Of those equal to or exceeding today's average output, 75 oil reservoirs had final production of greater than 435 bo/d and 478 gas reservoirs had final production greater than 1.6 MMcfd.
Of the 553 reservoirs with high final production rates, 11 were associated with storm-damaged platforms, requiring facilities as well as completion and reservoir performance analysis. For the balance of 542, the reason for abandonment was unknown. The study showed, however, that if all 553 high-rate abandoned reservoirs could be brought into production at their final rates, it would result in 76,525 b/d of oil and 2.7 bcfd of gas.
Historical analysis of field reserves
Each year from 1975 through 2010, the MMS published its independent estimates of the reserves in all fields in the Gulf of Mexico. Starting in 1995, the agency also estimated reserves at the sand level. Each year's report gives cumulative production, estimated reserves and their sum, and estimated ultimate recovery (EUR).
In theory, EUR should never fall unless remaining reserves are explicitly written down. This could happen because of a change in economics (e.g., drop in price) or realization that earlier technical assessments were optimistic (e.g., effective thickness found to be thinner or permeability lower than originally estimated). EUR can also fall for regulatory reasons (e.g., a reservoir assigned to one field is later reassigned to a neighboring field).
Close examination of all 1,296 fields and 14,288 sands evaluated by the MMS revealed three classes:
• Fields or sands with EURs that were never revised downward by the time they were depleted (or by 2010 for still-producing fields).
• Fields or sands that had insignificant negative revisions, indicating correction of entry errors or random fluctuations in the MMS analyses.
• Fields or sands for which there were large reductions in the MMS assessments of EUR.
This study focused on this last class (Fig. 4).
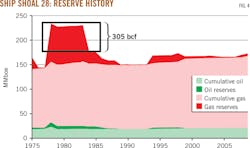
For all fields with large negative revisions, we conducted spatial checks to ensure that the resources subtracted from one field or sand was not simply credited to a neighboring field or sand. The relationship between revisions and lease holdings was also examined.
From the reserve history analysis, the study identified 74 fields with write-downs of greater than 10 million boe and 79 sands where the negative changes in EUR exceeded 5 million boe. Collectively, these negative revisions sum to 2.9 billion boe.
In all of these cases, because the presence of producible hydrocarbons is not in question, their geologic risk is minimal. In many cases, further engineering and geoscience work will show that the negative revisions were appropriate and would not be revised today-even in light of different economic and technical conditions. Among these 153 fields and sands, however, hydrocarbon volumes that were appropriate to write down 5, 10, and 25 years ago for technical or economic reasons could be profitable under current conditions.
Lost completions, sands
Two final study components mined databases on well tests and production and the BOEM Sand Atlas series to find anomalies that might be prospective.2
In the first case, all 59,025 completions were checked for initial tests with those results compared with subsequent production. Of these, 9% never produced but the remainder did. The interesting subset included those completions with good flow rates on initial tests that were never produced. In some cases, further analysis showed that the oil and gas that would have come from these completions were produced out of neighboring wells and additional potential from the unproduced completions was unlikely.
The core finding of this search was the set of 125 completions that were never produced but had initial tests that were higher than today's average rates of completion-level production-350 b/d for oil and 1.2 MMcfd for gas. The sum of the test rates of these 125 completions was 28,659 bo/d and 526 MMcfd. Under a general (and high variance) relationship between completion EUR and initial potential tests, together, these completions represent a mean of 58 million boe of producible oil and gas.
The search for "lost" sands centered on the Sand Atlas. It gives rock and fluid and gas properties and assessment of each sand's oil and gas resources. When the first Atlas document was published by MMS, it was a comprehensive list of all sands in all gulf fields that either had produced or had qualifying production but were not yet online (e.g., they were waiting for a pipeline connection or a platform). Every year, the BOEM added the sands of newly discovered fields and newly discovered sands in discovered fields to the Sand Atlas.
Because the Sand Atlas is a cumulative document, entered sands should remain. Some sands ultimately are reassigned to other sands as additional drilling and geophysical information indicate that what was earlier judged to be a separate accumulation was simply an extension of another sand. Examination of drilling and completion histories within a field and spatial analysis of its sands can usually identify such reassignments.
If reassignments are eliminated, 12 sands with EURs greater than 1 million bbl of oil or 10 bcf of gas simply disappeared from the Sand Atlas. As being added to the Sand Atlas requires detailed geologic and engineering data, it is unlikely that these represent postulated hydrocarbon accumulations. They collectively constitute about 43 million boe of recoverable resources; they were included in the Forgotten Oil and Gas study because some may constitute low-risk and profitable extension exploration and development opportunities.
Empirical findings
There are hundreds of millions of barrels of oil and trillions of cubic feet of gas producible but left behind in discovered Gulf of Mexico fields. Most of the remaining accumulations found in the study are too small to economically produce. However, from tens of thousands of reservoirs, hundreds of the accumulations identified are as large as or larger than the sizes of new reservoirs brought on line in the last 40 years.
These opportunities are diverse: from completions, to reservoirs, to sands, and to fields themselves. All these volumes are associated with fields that produced, and most include fields that are currently under production. This minimizes geologic risk and reduces costs through exploiting existing production and transportation infrastructure.
The study also demonstrates that mathematical and statistical methods for "mining" massive volumes of data-so widely and successfully applied in other industries-can be usefully employed in oil and gas. This is enabled by the existence and organization of comprehensive electronic databases on geology, drilling, testing, production, and reserves. Invested in all of the study components, where possible, were explicit evaluations of the statistical certainty underlying individual results.
References
1. Arps, J.J., "Analysis of Decline Curves," Transactions of the American Institute of Mining, Metallurgical and Petroleum Engineers, Vol. 160 (AIME, 1945), pp. 228-247.
2. US Minerals Management Service/US Bureau of Ocean Energy Management, Atlas of Gulf of Mexico Gas and Oil Sands Data (1995-2010).
The authors

John D. Grace ([email protected]) is chief executive officer of Earth Science Associates (ESA). He received his PhD in economics from Louisiana State University, Baton Rouge, and began his career in the geologic division of ARCO's Research & Development lab, then moved to corporate planning before founding ESA in 1991. He is a member of SPE.

Tony Dupont ([email protected]) is chief operating officer of Earth Science Associates, which he joined in 1999. He holds an MA in geography from California State University, Fullerton.

Scott Morris ([email protected]) joined Earth Science Associates as a Research Associate in 2012. He holds a bachelors in statistics from the University of California, Riverside, and a masters in applied mathematics from California State University, Fullerton.