Global oil market well supplied despite disruptions to producers
Conglin Xu
Senior Editor-Economics
Laura Bell
Statistics Editor
Despite disruptions in important producing countries, the oil market in the second half of 2014 remains well supplied.
Rising output from countries outside the Organization of Petroleum Exporting Countries and inventories will be able to cover growth expected in second-half oil demand of 1.5 million b/d over the same period last year.
US energy demand in 2014 will increase from the 2013 level as economic growth continues after the winter freeze.
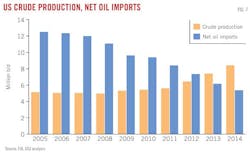
Largely because of a continuing surge from unconventional-resource plays, US oil production will increase again, more than offsetting the rise in demand and allowing net oil imports to continue a recent decline.
With oil inventories falling in Cushing, Okla., and rising on the Gulf Coast, meanwhile, the US refining business is changing dramatically.
Gradual recovery
The global economy remains on a path of gradual recovery, although data showed weakening in the first quarter as some economies grew less than expected at the start of the year. Still, prospects for the world economy in the remainder of the year remain positive.
On Jun. 16, the International Monetary Fund (IMF) cut its forecast of US economic growth in 2014 to 2% from an April estimate of 2.8%. This cut was largely related to contraction in the first quarter, when a harsh winter conspired with other factors including inventory drawdowns, a still-struggling housing market, and slower external demand. The US Federal Reserve bank also lowered its 2014 US economic growth forecast to 2.1-2.3% from 2.8-3% projected in March.
Growth in the euro zone also faces headwinds. The area's economy expanded only 0.2% in the first quarter, with high unemployment. Growth of 0.4% had been expected at the start of the year.
In Japan, domestic demand increased ahead of an anticipated sales tax increase in April, boosting GDP growth in the first quarter.
Emerging economies continue to grow slower than in past years due to weak domestic demand, tighter financial conditions, and, for some economies, political uncertainty. China's efforts to pursue sustainable development and limit air pollution lowered consumption and investment growth in the first quarter.
According to the IMF, recent data suggest a meaningful rebound is under way in the US and will continue in 2015. The IMF left its 2015 US economic growth prediction at 3%.
The Institute of Supply Management's Purchasing Managers' Index (PMI), excluding the euro area, edged up in May as a result of improvement in the US and Japan. Monetary easing by the European Central Bank helped increase expectations for economic growth.
Although China's growth will continue to moderate over the medium term with its structural shift, the country's manufacturing PMI showed slight acceleration in May.
Worldwide oil demand
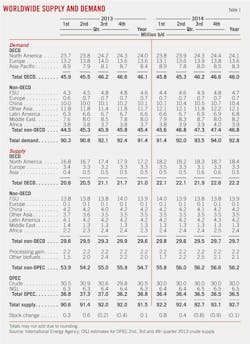
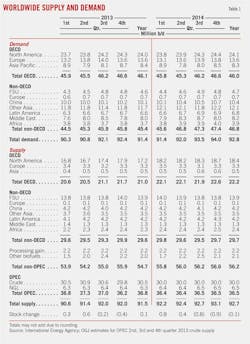
Global oil demand will average 92.8 million b/d this year, up from the 2013 average of 91.4 million b/d, according to the International Energy Agency. Emerging-market countries are projected to lead oil demand growth this year.
World oil demand averaged 91.4 million b/d in the first quarter of 2014 and will climb each successive quarter, IEA forecasts. Demand in the second half of 2014 is expected to increase by 1.5 million b/d over the same period last year to average 93.75 million b/d. In the fourth quarter worldwide oil demand will average 94 million b/d.
Oil demand of countries encompassed by the Organization for Economic Cooperation and Development is projected to be nearly flat from 2013, averaging 46 million b/d. Demand in OECD Asia Pacific is expected to contract less than it did a year earlier. Demand growth momentum will moderate somewhat in OECD Americas after the high baseline set in 2013. IEA projects 2014 demand of OECD Europe at 13.6 million b/d for the year, unchanged from 2013.
Outside the OECD, demand for oil will increase to 46.8 million b/d from 45.4 million b/d a year ago. In non-OECD Asian countries, demand will be 700,000 b/d higher than last year, topping the group. China's demand alone will climb 300,000 b/d this year.
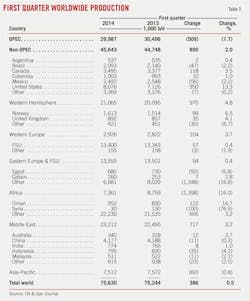
Global oil supply
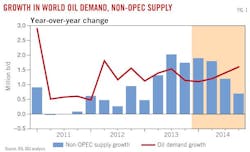
Supply from non-OPEC producers has been increasing and is projected to reach an average 56.2 million b/d in 2014, with the US being the main driver. This compares with 54.7 million b/d in 2013 and 53.4 million b/d in 2012.
In the second half of the year, non-OPEC producers are forecast to add 950,000 b/d vs. the same period a year ago to average 56.4 million b/d.
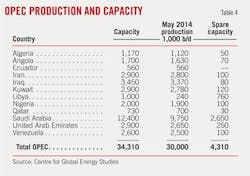
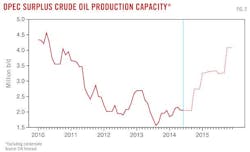
At OPEC's regular ministerial meeting in Vienna on June 11, the group agreed to maintain its 30 million b/d production target for 2014. "Effective" spare capacity in OPEC, which takes into account capacity not immediately available to the market, is estimated at 3.31 million b/d in May, 80% in Saudi Arabia.

For now, a terrorist incursion in Iraq hasn't cut Iraqi oil production. Supply from southern fields has increased enough to offset a cessation of exports from northern oil fields in March, when militancy halted pipeline shipments through Turkey.
OPEC's NGL production continues its long climb, projected to average 6.5 million b/d this year compared with 6.3 million b/d last year. OGJ forecasts OPEC crude output will average 30 million b/d this year. Global balances imply a global inventory drawdown of 100,000 b/d.
US economy
After the weather-related contraction of the first quarter, recent signs suggest improvement in the rest of the year for the US economy.
Conditions in the labor market continue to improve. According to the US Bureau of Labor Statistics, the US economy added 217,000 jobs in May, and the unemployment rate was 6.3%—1.2 percentage points below the same month of 2013. Nonfarm payroll additions grew by 217,000 in May this year, after 282,000 in April.
The Conference Board Consumer Confidence Index stood at 83.0 in May, after 81.7 in April and 83.9 in March.
The PMI for the manufacturing sector moved to 55.4 in May from 54.9 in April. Industrial production rose by 3.5% year-over-year in April. The PMI for the services sector, which constitutes more than two thirds of the economy, also grew in May.
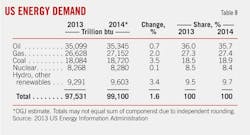
US energy demand
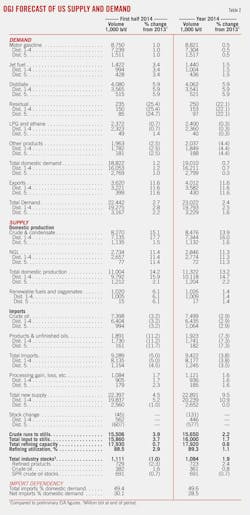
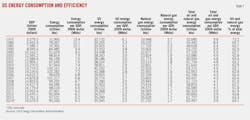
Demand for each major source of energy will grow this year, OGJ forecasts.
Oil demand in the US will climb 0.7% to 35.345 quadrillion btu (quads). Petroleum products' share of the US energy market will contract a bit to 35.7%, even as demand for many products climbs from a year ago.
Natural gas consumption is set to rise 2%, led by industrial usage. OGJ forecasts that gas demand this year will total 27.152 quads and account for 27.4% of all US energy supplied.
Oil and natural gas together are expected to account for 63.1% of total energy demand.
Year-over-year growth in gas prices will lift coal demand this year in the power sector. Demand for coal will total 18.72 quads, up 3.5% from a year ago and resulting in a gain for coal's energy market share to 18.9% from last year's 18.5%. In 2015, demand for coal will decline because of the retirement of some coal-fired power plants.
The use of hydroelectric power and other renewable forms of energy will grow by 3.4% this year, but this group will still account for the second-smallest share of the US energy market.
US nuclear energy use will total 8.28 quads, up from last year's 8.27 quads.
Crude oil prices
Crude oil price relationships in the US have been shaped by the start-ups of several pipelines between the pricing and storage hub at Cushing, Okla., and the large refining center along the Gulf Coast.
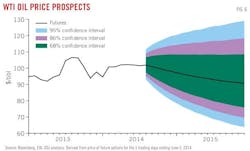
Oil in storage at Cushing has fallen more than 20 million bbl since late January. The drawdown and strong refinery runs helped strengthen the price of West Texas Intermediate (WTI) crude, the spot price of which increased from an average of $95/bbl in January to $102/bbl in April and May.
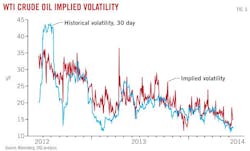
According to the US Energy Information Administration, the futures price of WTI for September 2014 delivery, traded during the 5-day period ending June 5, averaged $101/bbl. Implied volatility averaged 14%. Last year at this time, WTI for September 2013 delivery averaged $94/bbl, and implied volatility averaged 23%.
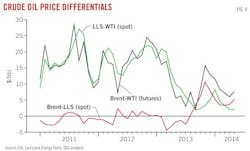
The premium of Brent crude over WTI narrowed to below $10/bbl in the first quarter of 2014, nearly $9 below the average recorded in the same quarter a year earlier. The differential was $7/bbl in May.
The Louisiana Light Sweet (LLS) price has been suppressed by the surplus developing on the Gulf Coast, benefiting refiners there. The Gulf Coast price marker has weakened against both Brent and WTI in recent months.
The front-month futures price of WTI on the New York Mercantile Exchange continues to stand at a premium over later months' contracts, supported by depleting crude stocks at Cushing. This relationship, called backwardation, has strengthened as inventory withdrawals at Cushing picked up in the summer.
Multiple factors, including supply disruptions in Libya and other geopolitical concerns, also have supported backwardation in the Brent futures market.
Meanwhile, implied volatility of the WTI crude price has eased to multiyear low.
Product prices
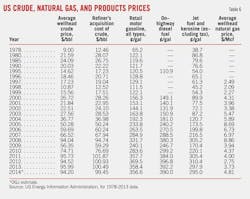
US annual average refined product prices, which fell in 2013, will sag again in 2014.
Last year's average retail price for all types of gasoline was $3.58/gal, according to EIA. The peak monthly average last year was in March, $3.78/gal. OGJ forecasts that retail prices for all types of gasoline this year will average $3.56/gal.
Gasoline demand will increase slightly this year, while higher gasoline output and reduced crude oil cost will suppress prices, although taxes are up slightly. Taxes on regular unleaded self-serve gasoline currently average 42.4¢/gal nationally, up from 41.8¢/gal at the start of last year.
Meantime, during the April-September driving season this year, regular gasoline retail prices are forecast to average $3.61/gal, 3¢ higher than last year, according to IEA's most recent estimate.
OGJ forecasts that the price of on-highway diesel fuel will average $3.90/gal this year vs. $3.92/gal last year, thanks to lower crude oil cost. Jet fuel prices will average $2.95/gal this year vs. $2.97/gal for 2013.
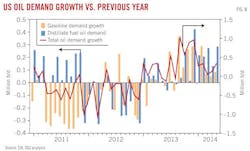
US oil demand
Total US liquid fuels consumption rose by an estimated 400,000 b/d, or 2.1% in 2013. Total consumption in 2014 will grow at a slower rate of 0.7% to average 19.01 million b/d, OGJ forecasts. The bulk of the increases will be for industrial and transportation fuels, especially distillates, gasoline, and jet fuel, partly offset by declines in consumption of residual fuel oil, liquefied petroleum gases (LPG), and unfinished oil.
The improving economy and rising industrial production support overall oil demand growth this year. In particular, the cold weather in January and February also helped lift demand. However, the growth of oil demand is subject to downside risks including the higher baseline in 2013, increasing vehicle fuel efficiencies, and fuel substitution, notably with gas in industrial and residential markets.
Over the first 5 months of 2014, motor gasoline demand gained 1.1% from a year earlier to average 8.69 million b/d, according to preliminary data from EIA. OGJ forecasts that this year's demand for gasoline at 8.82 million b/d, 0.5% higher than a year earlier. This small increase in gasoline consumption is underpinned by economic growth and slightly lower retail gasoline prices, which encourage miles traveled by light-duty vehicles, partly offset by improving vehicle-fuel efficiency.
Distillate fuel consumption increased by 90,000 b/d (2.5%) last year. Demand during the first 5 months of 2014 gained 5.7% from the corresponding period of 2013 to average 4.11 million b/d, reflecting increased use by industrial and transportation consumers as well as cold weather. OGJ forecasts that distillate fuel oil consumption in 2014 will rise by 227,000 b/d, or 6%, to average 4.06 million b/d, considering sustaining economic recovery in the second half of the year.
Jet fuel demand over the first 5 months of 2014 increased 3.7% from a year earlier, averaging 1.41 million b/d. OGJ forecasts that jet fuel consumption will average 1.44 million b/d this year.
Consumption of LPG increased by 157,000 b/d (7%) in 2013. During the first 5 months of 2014, LPG consumption averaged 2.42 million b/d, down 1.5% from a year earlier. This decrease probably reflects below-normal propane inventories in the Midwest and high prices early this year. However, demand for LPG and ethane, supported by expanding ethylene production capacity, continues to be sizable as last year.
Demand for residual oil is estimated to decline as much as 22% this year.
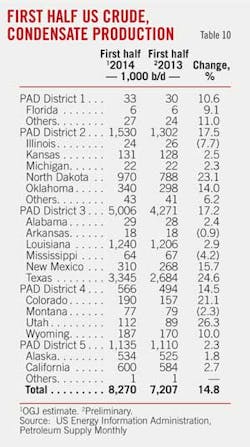
US crude production
Strong oil production growth is expected this year, especially in the Eagle Ford, Bakken, and Permian regions. During the first half, US crude oil production, including lease condensate, was estimated at 8.3 million b/d, compared with 7.2 million b/d in the first half of 2013 and 6.3 million b/d in the first half of 2012. OGJ forecasts that total US crude oil production will increase from an estimated 7.4 million b/d in 2013 to 8.5 million b/d in 2014. The growth is mainly of light sweet crude from tight formations.
Production from Lower 48 tight oil and shale plays has increased dramatically. During the first half of this year, oil production in North Dakota and Texas increased 23.1% and 24.6%, respectively, from the prior year, according to EIA data.
As new wells in Mars field began producing ahead of schedule, Gulf of Mexico crude oil production is forecast to increase in 2014 and 2015 after falling for 4 years.
Production in Alaska increased 1.8% in the first half from the same period a year earlier to average 534,000 b/d.
NGL production will average 2.85 million b/d this year, up from 2.6 million b/d last year as output rises from rich-gas shale plays.
US oil trade
This year the US will import almost 4% less crude oil and petroleum products than it did during 2013, while exports—mostly of products—will increase 12%, according to preliminary estimates of OGJ. This sustained a trend of increasing exports and decreasing imports, reflecting the surging domestic oil production and refinery runs approaching historic highs.
US crude imports in the first half averaged 7.4 million b/d, a decline of 3.2% from the same period last year. Meanwhile, product imports for the first half dropped by 11.2%. Year-to-year, crude and product imports are projected to be lower by 2.9% and 7.3%, respectively. Although declining, 2014 forecasts for US imports remain high: 7.49 million b/d of crude and 1.92 million b/d of products.
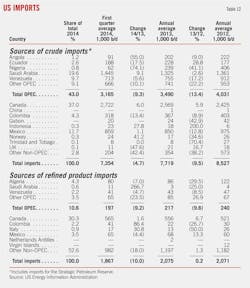
In 2013, the leading source of US crude oil imports was Canada, from which the country received an average 2.57 million b/d. The second-largest source for crude imports last year was Saudi Arabia, followed by Mexico, Venezuela, and Colombia.
Canada also was the leading source of US product imports in 2013. The US imported an average of 556,000 b/d of products from Canada. The next largest sources of products imported by the US were Algeria, Mexico, and Venezuela.
US exports of crude oil, greatly restricted by law, averaged 268,000 b/d in April, according to the US Census Bureau, a 15-year high. Canada remains the main destination of US crude exports. Most of the recent increase has been from the Gulf Coast, which averaged 134,000 b/d in the first quarter of 2014 after a record high 35,000 b/d last year.
US exports of petroleum products have increased since 2010. According to the EIA, exports of distillate fuels in 2013 increased 110,000 b/d over the previous year to 1.1 million b/d. Propane exports increased 130,000 b/d in 2013, averaging 300,000 b/d for the year, with almost half going to Central and South America. Exports to Europe also doubled from 2012 levels to 55,000 b/d. Gasoline exports averaged 550,000 b/d for the year, a 45,000 b/d increase over the level in 2012, with increases to Africa, Central and South America, and Mexico.
During the first quarter of 2014, total product exports showed an increase of 20% from a year earlier.
Combined, US net oil imports this year will drop 12.7% to 5.41 million b/d, according to OGJ. Correspondingly, the share of domestic demand met by net imports will decline to 28.5% from 32.8% a year ago.
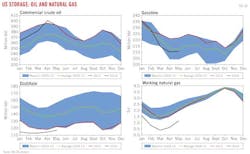
Oil inventories
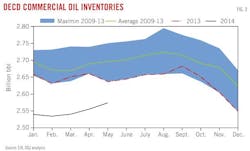
As cold weather at the start of the year spurred oil demand and hampered production, crude oil and product inventories during the first couple of months stood lower than their 2013 levels. As oil production and refining operations recovered, inventories began to rebuild.
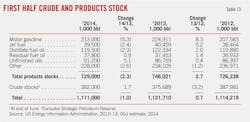
At midyear 2014, commercial crude oil inventories in the US are expected to be about 382 million bbl, up from 376 million bbl a year earlier. Product stocks, meanwhile, are down from the middle of 2013, totaling about 729 million bbl vs. 746 million bbl at the end of last June.
Commercial crude stocks will finish 2014 at an estimated 361 million bbl, up from 358 million a year earlier. The volume of oil in the Strategic Petroleum Reserves (SPR) is likely to close out 2014 at 691 million bbl, lower than 696 million bbl at the end of last year.
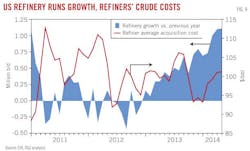
Refining, crude prices
Refining activity will remain high in the US this year as operating margins continue to benefit from relatively cheap feedstock costs and low natural gas prices.
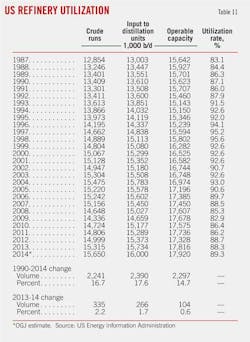
Operable capacity at US refineries will average 17.92 million b/d this year, up from 17.82 million b/d a year ago. Total inputs will climb 1.7% to average 16 million b/d. Crude runs, up 2.1% to 15.31 million b/d last year, are projected to increase 2.2% to 15.65 million b/d this year.
After the start of the driving season and the end of seasonal maintenance, refinery utilization rates in the US continued to rise, averaging 89.5% in May compared with 88.2% a year earlier. OGJ forecasts that refinery utilization will average 89.3% for the full year, up from last year's 88.3%.
The average US wellhead price of crude oil in 2014 is projected at $94.20/bbl, down from $95.99/bbl a year earlier.
The composite refiner acquisition cost of crude oil is projected to average $99.45/bbl this year, down from $100.49/bbl for the prior year.
According to the latest figures from Muse, Stancil & Co., cash refining margins during the first 5 months of this year were up from a year earlier by 32.8% on the Gulf Coast to an average of $9.70/bbl, while down 20.9% on the East Coast, 33.8% in the Midwest, and 11.5% on the West Coast.
After southbound crude flows from Cushing accelerated last year, the Gulf Coast price marker, LLS, began trading at a discount to Brent crude. This helped Gulf Coast refiners because the prices of US products, which unlike crude can be exported, tend to track the Brent price.
In the US Midwest, refinery feedstock costs were 7% higher in the first 5 months of this year than they were in the comparable period a year earlier as the WTI price moved toward convergence with Brent. Although average feedstock costs year-to-date declined marginally for East and West Coast refiners, lower product revenues and higher variable and fixed costs led to lower margins compared to a year ago.
Overall, US refiners are more profitable than their international counterparts because of their crude-cost advantage.
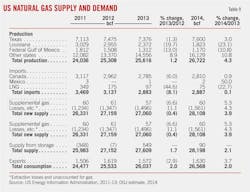
Natural gas demand, supply
OGJ forecasts that US natural gas demand will total 26.6 tcf in 2014, an increase of 2% from last year.
Natural gas use for residential and commercial purposes was more than 9%, or 2.75 bcfd, greater during the first 5 months of 2014 than in the same period of 2013, reflecting extremely cold weather at the start of the year. But the annual growth rate of residential and commercial gas demand will be only about 2% if weather is normal at the end of the year.
Industrial gas usage increased 5%, or 1.06 bcfd, during the first 5 months of 2014 than in the comparable period of 2013, supported by start-ups of gas-intensive industrial projects and increased industrial shipments. As the economy rebounds in the second half of the year, industrial gas usage is projected to keep its momentum and contribute most to overall growth in natural gas consumption this year.
Gas consumption for electric power generation decreased 0.8% during the first 5 months of the year from its year-earlier level. In its most recent Short-Term Energy Outlook, EIA said it expects gas consumption to fall by 0.5% in the power market this year because of higher gas prices. Consumption is expected to head back up in 2015, with lower gas prices and the retirement of some coal plants.
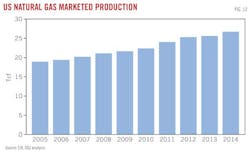
OGJ forecasts total US marketed production of natural gas to grow 4.3% in 2014 to 26.7 tcf, largely on the strength of the Marcellus shale play. Last year total US marketed gas production increased 1.2%.
Gross output from the Marcellus play will average almost 15 bcfd in July, up 26% from a year earlier, according to EIA.
Boosting Marcellus production growth are increasing capacities to process liquids-rich gas and to move gas and liquids to market. ANR Pipeline's Lebanon Lateral recently began sending Marcellus natural gas west to ANR's mainline, for example. And Texas Eastern Transmission expects to bring on line 900 MMcfd of capacity to move gas out of Appalachia in November 2014.
The National Oceanic and Atmospheric Administration projected in May near or below-normal tropical weather during the 2014 hurricane season in the Atlantic Basin. Fewer storms would mean fewer production disruptions in the Gulf of Mexico. As the share of total US gas production from offshore fields has declined sharply, however, the vulnerability of US gas supply to hurricanes has been reduced.
Growing domestic production will continue to put downward pressure on natural gas imports, which nevertheless were relatively high in the first 5 months of the year. For all of 2014, OGJ projects gas imports of 2.89 tcf.
LNG imports have fallen over the past several years because of prices in Europe and Asia higher than in the US as well as surging gas production. OGJ forecasts that LNG imports this year will decline 22.7% to 75 bcf.
Gas exports are expected to increase 3.7% this year to 1.63 tcf. Net US imports of natural gas will fall to 1.18 tcf this year from 1.21 tcf last year, continuing a decline that began in 2007.
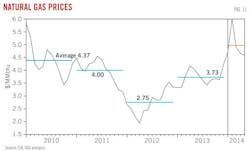
Gas prices, inventories
The average Henry Hub natural gas spot price will be $4.81/MMbtu this year, up from $3.73/MMbtu in 2013 and $2.75/MMbtu in 2012, OGJ forecasts.
In the first half of 2014, Henry Hub spot prices averaged $4.92/MMbtu, up $1.20/MMbtu from a year earlier. Front-month futures prices for gas averaged $4.66/MMbtu in this year's first half, compared with $3.76/MMbtu in last year's first half.
Growth in gas demand and the need to replenish gas inventories will support prices for the next few months.
As a frigid winter led to record-breaking storage withdrawal, the average of end-of-month values for natural gas working inventories over the first 5 months was down 38.7% from the corresponding period a year earlier and down 39% from the 5-year average, according to EIA data. In March, gas inventories fell to 857 bcf, an 11-year low.
Record production will help boost gas inventories in the upcoming injection season. Weekly storage injections this summer could total 83 bcf, according to an estimate of the Natural Gas Supply Association.
However, the high storage build would not fully erase the deficit caused by this past winter. Inventories at the end of this October, the start of the heating season, would still be at risk of being at their lowest level since 2008.