OFFSHORE DRILLING RISKS—1: Study: Risk indicators have varying impact on mitigation

M. Sam Mannan
Ray A. Mentzer
Tony Rocha-Valadez
Anne Mims
Texas A&M University
College Station
More oil and gas wells are drilled onshore than offshore, requiring more man hours and creating more exposure to risk. As a result, onshore drilling consistently has higher lost-time-incident (LTI) rates and total-recordable-incident (TRI) rates than offshore. However, offshore drilling still has high LTI and TRI rates compared with other industries.
This two-part article analyzes safety statistics of offshore and onshore drilling, presents lessons regarding offshore drilling incidents, and identifies which indicators may be analyzed to improve current safety statistics.
Data from four sources are used: International Oil and Gas Producers Association (OGP), United Kingdom Health and Safety Executive (UK HSE), International Association of Drilling Contractors (IADC), and the Bureau of Safety and Environmental Enforcement (BSEE) in the US Department of the Interior.
Our objective is to provide additional sources of data for the development of process-safety indicators while presenting expert opinion from existing literature for leading and lagging process-safety indicators that may not have been implemented for offshore operations.
In this first article, we look at how leading and lagging indicators have evolved, we discuss the validity of current indicators, and we scrutinize their applicability to drilling operations. Finally, onshore and offshore safety statistics are compared.
The second and concluding article (OGJ, June 2, 2014) will present more data from the agencies, analyze trends, and provide recommendations for future action.
Categorizing risk
Such incidents as Piper Alpha in the North Sea (1988), the Texas City, Tex., refinery explosion (2005), and the Macondo deepwater Gulf of Mexico blowout and spill (2010) have made it clear that personnel safety and process safety cannot be treated interchangeably. The same holds true for personnel safety and process safety performance metrics.
There have been many efforts to reduce risk in process-safety incidents, particularly for offshore drilling where operating conditions can be extreme. For example, operators have tried promoting a positive safety culture, encouraging risk communication, and enforcing such safety programs as safety and environmental management system (SEMS) in offshore facilities.
However, determining the impact of implementing new safety programs or of any strategy for that matter can only be done by having proper performance indicators that represent the risk one is trying to reduce.
The importance of process-safety indicators is reflected in the many studies of the subject since the 1990s. A special issue of Safety Science was dedicated solely to safety indicators just in 2009, only 1 year before the Macondo disaster (Vol. 47, 2009).
Perhaps one of the most extensive projects addressing safety indicators was the Risk Level Project (RNNP) in Norway. Leading and lagging indicators were used to assess annually the risk level of the Norwegian oil and gas industry.
The first report was published in 2001 and contained data from the previous 5 years (1996-2000).1 A more in-depth analysis of these indicators was done by Vinnem,2 who grouped risk into five levels:
- Risk due to major hazards.
- Risk due to incidents that may represent challenges for emergency preparedness.
- Occupational injury risk.
- Occupational illness risk.
- Risk perception and cultural factors.
Occupational injury and illness risks have been widely studied and have mature safety indicators, such as TRI and LTI, which have proven to be effective in monitoring trends in these risk factors.
Safety culture, although not as directly measurable, has been widely studied. Special methodologies to assess safety culture in offshore environments have been developed,3 an example being an offshore safety questionnaire.4-7
The first level described by Vinnem2 was subclassified into two indicators:
1. Those based on occurrence of incidents and near-misses.
2. Those based on performance of barriers that are installed in order to protect against hazards and their potential consequences.2
Major hazard corresponds to process-safety deficiencies and is not as broadly analyzed. Debate continues over what type of indicators should be used and which ones could actually work. A focus on current indicators for major hazards, particularly for preventing blowouts, and expert opinion of feasible and efficient future indicators is revealing.
Current risk indicators
Skogdalen et al. studied the safety indicators in the RNNP project and established the relevance of some as leading indicators for oil and gas blowouts. Skogdalen concluded that the indicators used in RNNP to monitor major-hazard, process-safety risk in Norway recorded 80-100/year precursor events in the Norwegian Continental Shelf. That is less than one precursor event per installation each year.8
The researchers concluded that this indicator might provide early warning for major-hazard risk at a global level, but not for individual facilities. However, this is unlikely due to the lack of uniformity in indicators used worldwide.
Skogdalen also concluded that the barrier performance indicator would be useful for individual installations because more data would be available. Finally, Skogdalen presents different sets of performance indicators that could be implemented as leading indicators for blowout prevention.
After the US Chemical Safety and Hazard Investigation Board's (CSB) findings following its investigation of the Texas City refinery incident, the American Petroleum Institute (API) published its own recommended practice for process safety. Known as API RP-754, this new standard categorizes incidents into four tiers.
While it was developed for refining and petrochemical industries, API noted that it may be applicable to other industries with operating systems in which loss of containment has the potential to cause harm, such as offshore operations. It can be used as a guideline for designing safety programs, with appropriate indicators to prevent dangerous well occurrences. In fact a form of it is now required in offshore Gulf of Mexico operations under SEMS.[reference?]
In API-RP-754, Tiers 1 and 2 are process-safety events with standard definitions.9 Tiers 3 and 4 are challenges to safety systems and management-system indicators as defined by companies.9 This recommended practice, although a step toward a unified reporting system for process-safety incidents, may have shortcomings.
Some have pointed out the inclusion of events in Tiers 1 and 2 that would not necessarily present major hazards, while leaving out important precursors, such as cement failure or kicks, that are known to be precursors to blowouts. In addition, arguments against statistical significance, similar to those of the RNNP, have questioned the application as a "global" indicator.
Andrew Hopkins also provides some discussion regarding the topic of blowouts from his analysis for the CSB of the Macondo incident. Hopkins discusses not only the logistics of blowouts, but also the leading and lagging process-safety indicators that could be used as preventative measures to lower the frequency of blowouts.10
Hopkins begins by analyzing API RP-754 and makes clear that he does not fully agree with all of the incidents that are considered "recordables" nor with the categorization of them into the four tiers.
API RP-754 puts "loss of containment" events into Tier 1, defined as less frequent but with the largest consequences. However, Hopkins states that "drill gas" and "vent gas" do not indicate a kick or a precursor to a blowout. This would mean that loss of containment is not properly placed in its current tier.10
Hopkins also states that loss of containment should only be incorporated into Tier 1 if it is in an applicable industry (i.e.. refineries and petrochemicals) while excluding drilling from this list of industries.
Another category lumped into Tier 1 that Hopkins does not believe belongs is oil spills. Hopkins says that oil spills clearly have an environmental impact, but their impact on process safety is minimal if at all. In root-cause analysis, oil spills, such as loss of containment, are rarely the primary cause of major process-safety incidents but more of a consequence.
There are other indicators that are not present within the four-tier pyramid of API RP-754. For example, there were 39 blowouts in the Gulf of Mexico within a 15-year span (1992-2006), making them too infrequent to be used as a meaningful statistic regarding process safety.10
For Hopkins, the first indicator to consider adding to API RP-754 is kicks. These are an immediate precursor to a blowout, and many times drillers do not recognize that a kick is occurring until too much time has passed.10 Each well is different. Some wells have a much greater propensity to kick, while each kick may be different in severity.
Hopkins suggests that there are two indicators related to kicks that could be useful: the response time to kicks and their severity.10 Analyzing these two indicators can determine the relationships between kicks and blowouts. If added to API RP-754, kicks should be implemented as a Tier 3 indicator due to their high frequency and presence as a precursor to large-scale catastrophic events such as blowouts.
The other indicator that Hopkins suggests be included within API RP-754 is cement failures. Eighteen of those 39 blowouts mentioned previously were caused by cement failures, making them an important component in developing leading indicators.10 Cement failures would also appropriately fit into Tier 3 events.
Hopkins is not the only author scrutinizing blowout safety indicators used. J.E. Skoldagen, who has written for Science for Environmental Policy, a newsletter produced by the Norwegian Oil and Gas Industry, also has ideas regarding them, specifically in response to the 2010 Macondo incident.11
Skoldagen begins by separating blowout indicators into five categories, each of which has a different purpose but when combined can be very effective:
• Indicators related to schedule or cost. The purpose of this indicator is to monitor when projects are behind schedule and over budget, allowing for a more realistic timeframe to be implemented that mitigates the risk of hasty and potentially unsafe decisions.11
• Indicators based on well incidents. This indicator is also endorsed by Hopkins and tracked by the UK HSE.11 The purpose of tracking well incidents is to find relationships between kicks, low-density mud, and the presence of mud with gas bubbles, ultimately revealing how all of these relate to blowouts.
• Indicators related to operators' well response. This indicator takes into account the time it takes an operator to recognize an issue and resolve it. This is specifically important in less-frequent, more-catastrophic incidents, at topic also discussed by Hopkins. A perfect example is the Macondo incident in which a kick went undetected and the first indication of well-control response was 49 min after the initial influx of hydrocarbons into the well.
• Indicators related to operation of the well, rig. This indicator can be obtained by analyzing the communication, authority, and training of individuals present on the rig.11 This indicator allows us to confirm that operators are able to combat unsafe conditions, such as blowouts and kicks.
• Indicators based on technical condition of safety-critical elements. Many times safety-critical systems are not properly monitored. Because they are of the highest importance when danger is present, proper maintenance must be done to ensure that these elements are ready and functioning.11
As we can see from the studies cited here, much effort has been made to develop leading and lagging process-safety indicators. And much debate continues on this topic as well.
In most cases, the data studied to generate these indicators are based on a single region of the world. We believe it is important to have a global view of the reporting systems available and the type of information that can be analyzed.
Data are reported in different ways by different systems. Nevertheless, several similarities can be observed that could be keys to obtaining performance indicators that are comparable from a global perspective.
Risk-data comparisons
Many organizations publish two types of statistics: statistics of exclusively offshore drilling safety and statistics that include both offshore and onshore drilling safety. Our analysis takes into account both.
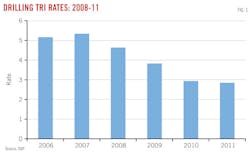
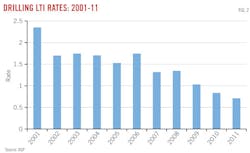
According to OGP data, safety in onshore and offshore drilling has consistently improved over the last 5 years. This can be seen by the decreasing trend in TRI rate for the last 6 years and LTI rate for the last 11 years (Figs. 1 and 2).
Even though drilling has seen an overall improvement in safety statistics, comparing data from 2011 with a TRI of 2.84, it still exceeds other industries, such as petroleum and coal products manufacturing (TRI: 2.0),16 chemical manufacturing (TRI: 2.4),16 and pipeline transportation (TRI: 1.5).16
Starting in 2010, OGP began publishing data regarding the number of fatalities during drilling operations, well services, and well workovers. The last 2 years of OGP statistics indicate that most fatalities in offshore and onshore drilling occur due to "explosion or burns" or "struck by" (Fig. 3).
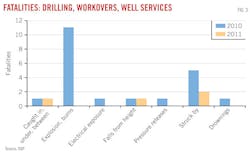
The contrast between the number of fatalities due to "explosion and burns" 2010-11 stands out. This is due to a single incident, Macondo, that killed 11 people and was clearly, a low-frequency, high-consequence event.
On the other hand, "struck by" has been consistently a leading cause of fatalities within offshore and onshore drilling for at least the 2 years reported by OGP. Overall, fatal accident rates show improvement or flat rates for the past 2 years regardless of the cause of the drilling incident (Fig 3).
OGP annually publishes summaries of select, anonymous incidents to encourage companies to share lessons learned from recordable incidents and fatalities. OGP-published incident summaries that occurred from 2008-10 contained 157 incidents in 2010, 66 in 2009, and 82 in 2008. This provided a 305-incident sample for study.
The proportion of "pertinent safety cases" attributed to "struck by" during 2008-10 is documented in Fig. 4. This graph shows that "struck by" is consistently about a third of the total incidents analyzed for learnings, making them common and in need of improvement.
Most onshore struck-by incidents were attributed to motor vehicles. In most of these incidents the causes were due to motor vehicles backing up without proper spotters, objects not being properly secured on the vehicles, or a lack of visibility due to fog or height difference between vehicles and people.
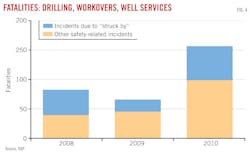
Offshore "struck by" incidents were predominantly due to unexpected slackening or tightening of lines during drilling and workovers, and poor risk management in lifting and craning (Fig. 4).
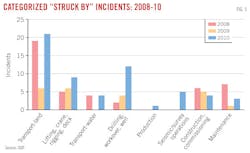
Each of these struck-by incidents was categorized when recorded (Fig. 5). The largest number of struck-by incidents is attributed to motor vehicles (transport-land). Drilling, workovers, well services, and lifting, crane, rigging and deck operations are the next leading categories of struck-by incidents after land transportation.
References
1. Norwegian Petroleum Directorate, Development in Risk Level-Norwegian Shelf. Summary Report, Norwegian Petroleum Directorate, Stavanger, 2011.
2. Vinnem, J.E., Risk indicators for major hazards on offshore installations. Safety Science, Vol. 48 (2010), pp. 778-787.
3. Cox, S.J., and Cheyne, A.J.T., Assessing the safety culture in offshore environments. Safety Science, Vol. 34 (2000), pp. 111-129.
4. Mearns, K., Flin, R., Fleming, M., and Gordon, R., Human and Organisational Factors in Offshore Safety, in HSE Report OTH 5431997, Norwich, UK: HM Stationary Office, 1998.
5. Mearns, K., Flin, R., Gordon, R., and Fleming, M., "Measuring safety climate on offshore installations," Work and Stress, Vol. 12 (1998), pp. 238-254.
6. Rundmo, T., "Associations between safety and contingency measures and occupational accidents on offshore petroleum platforms," Scandinavian Journal of Work Environment and Health, Vol. 20 (1994), pp. 128-131.
7. Rundmo, T., "Associations between risk perception and safety," Safety Science, Vol. 24 (1997), pp. 197-209.
8. Skogdalen, J.E., Utne, I.B., and Vinnem, J.E., "Developing safety indicators for preventing offshore oil and gas deepwater drilling blowouts," Safety Science, Vol. 49 (2011), pp. 1187-1199.
9. API, RP-754 Process Safety Performance Indicators for the Refining & Petrochemical Industries, Washington: American Petroleum Institute, 2010.
10. Hopkins, A., "Safety Indicators for Offshore Drilling- A Working Paper for the CSB Inquiry of the Macondo Blowout," US Chemical Safety and Hazard Investigation Board, 2012.
11. Skogdalen, J.E., "Deep-water Drilling: Improve Safety Indicators to Help Prevent Disasters," DG Environment News Alert Service, European Commission: Science for Environment Policy, 2011.
12. Safety Performance Indicators—2008 Data, International Oil & Gas Producers Association, 2009.
13. Safety Performance Indicators—2009 Data, International Oil & Gas Producers Association, 2010.
14. Safety Performance Indicators—2010 Data, International Oil & Gas Producers Association, 2011.
15. Safety Performance Indicators—2011 Data, International Oil & Gas Producers Association, 2012.
16. "Work Place Injuries and Illnesses 2011," Bureau of Labor and Statistics 2012.
The authors

M. Sam Mannan ([email protected]) is Regents professor in the chemical engineering department at Texas A&M University and director of the Mary Kay O'Connor Process Safety Center at the Texas Engineering Experiment Station. Before joining Texas A&M, he was vice-president of RMT Inc., an engineering services company. He holds a bachelors in chemical engineering from Bangladesh University of Engineering and Technology, Dhaka, and a masters and PhD in chemical engineering from the University of Oklahoma. Mannan is a registered professional engineer in Texas and Louisiana and a certified safety professional.

Ray Mentzer ([email protected]) is a lecturer in the chemical engineering department at Texas A&M University and a member of the Mary Kay O'Connor Process Safety Center at the Texas Engineering Experiment Station. He worked for ExxonMobil for more than 28 years in a variety of upstream, technical, and managerial assignments, several related to personnel and process safety. Mentzer holds a bachelors in chemical engineering from the University of Illinois and a masters and PhD in chemical engineering from Purdue University, Indiana.

Tony Rocha-Valadez ([email protected]) is a PhD candidate in the chemical engineering department at Texas A&M University and a research assistant at the Mary Kay O'Connor Process Safety Center at the Texas Engineering Experiment Station. He holds bachelors and masters degrees in chemical engineering from the Technology Institute of Celaya, Mexico.

Anne H. Mims ([email protected]) is a petroleum engineering student in the Harold Vance department of petroleum engineering at Texas A&M University and a safety-certificate candidate in the Mary Kay O'Connor Process Safety Center at the Texas Engineering Experiment Station. She will receive her bachelors in petroleum engineering in May of 2014.