Oil-price patterns—1: Oil prices reflect uneven growth rates of global demand and supply
Manouchehr Takin
Centre for Global Energy Studies
London
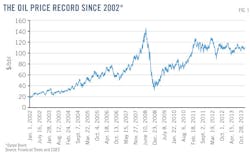
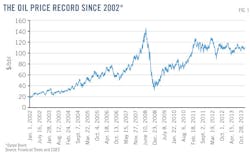
The price of oil rose from below $30/bbl to more than $145/bbl (all in money of the day) between 2004 and 2008 (Fig. 1). This was unprecedented. The price had fluctuated within the $20-30/bbl range in the previous 2 decades, and the fivefold increase over a period of about 4 years was a shock. The reason for the price rise remains a major question and subject of debate.
Numerous explanations are given for the unprecedented rise of the price of oil in the mid-2000s. Blaming the Organization of Petroleum Exporting Countries is the most common of them. It is argued that the organization was slow to increase its production, and when it did increase the amount was insufficient. It is also argued that when OPEC increased its production, the consequent reduction in spare (unused) oil production capacity caused the oil price to rise further because of the smaller cushion available to cover the world oil market against unforeseen disruptions. Concern about a possible supply shortage kept the price high.
Another explanation for the oil price rise, given by the executives of some major oil companies, is that the cost of producing oil rose to more than $80/bbl, which made the price of oil rise above $100/bbl. This explanation has been critically analyzed by the Centre for Global Energy Studies.1 The study shows that in the mid-2000s the cost of oil production did rise, but not to such high levels and that, more importantly, costs soon came down for most components of exploration and production. It was also clearly illustrated that field activities increased after the rise in the price of oil. Higher revenues allowed oil companies to increase their field expenditure, which in turn led to increased demand for field equipment, materials, and services and made their prices go up, thus increasing the cost of production. In other words, the high price of oil led to an increase in the cost of production. Arguing the opposite is putting the cart before the horse.
Speculation and the utilization of derivatives and complicated financial instruments in the oil market are other explanations given for the rapid oil price rise in the mid-2000s. The debate on this question extended to the US Congress, which heard testimony by expert witnesses on the distorting impact of financial participants on the oil market. Most analysts agree that financial players accelerated an already established trend of rising oil prices. The speculative activity made the price go higher than was otherwise justified. There was a global "bubble" in equity and financial markets boosted by "irrational exuberance" and unjustified optimism. These and other factors influenced perceptions in the oil market in the same way that they influenced the general market. In addition, the high price of oil itself became a self-perpetuating prophecy that affected oil market psychology and contributed to the rising price trend. The notion that the world was running out of oil was in vogue again, and it had become fashionable for analysts to remind themselves that the world's oil resource base is finite.
Finally, some observers have tried to explain the unprecedented rise in the price of oil by market manipulation and global conspiracy, though these are hotly debated even today.
Although all the above and many other factors could have contributed to the rise in the price of oil, the most important and yet simple answer to the question why oil prices quintupled during 2004-08 is that the growth of world oil supply could not keep up with the growth of world oil demand.
This article will show how an imbalance between supply and demand has influenced the price of oil until the present. A second article, to appear May 5, will analyze how this relationship might influence prices in the future.
Long lead times
A point that cannot be overemphasized is that an oil company needs years to do preliminary research on an area, negotiate with the relevant government and sign an agreement, conduct surveys, drill exploration wells, and hopefully make a discovery. It then takes many more years to develop the discovered oil field and achieve a streamlined and sustainable level of production.
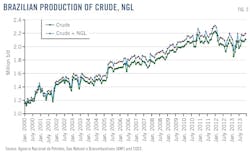
For example, in Brazil it took years to improve exploration methods such as seismic surveys and interpretation for presalt horizons, carry out systematic exploration programs, locate prospects, and drill exploration wells through the thick salt layer in deep water. However, in spite of the huge presalt oil discoveries and field developments under way in the last few years, the country's oil production has not yet increased. It actually fell in 2012 and only partly recovered in 2013 (Fig. 2).2
In Iraq, giant and supergiant fields discovered in the past had been appraised, and some were partly brought onstream, especially in the south of the country. Following the fall of President Saddam Hussein in 2003, the Iraqi government signed contracts during 2009-10 with well-known international oil companies for systematic development of some of those fields. Based on the companies' contractual commitments at the time, Iraq's oil production was expected to reach more than 12 million b/d by 2017. It is now generally recognized that the production targets were too ambitious because of practical realities and constraints on field operations. The country's production reached just above 3 million b/d at the end of 2013, an outcome foreseen by CGES 3 years ago.3
Kashagan field in Kazakhstan's shallow Caspian waters, discovered in 2000, has been under development by international oil companies and was expected to commence production about the mid-2000s. As with the other examples, the size of known fields and the exciting exploration prospects had caused great excitement in the industry and in the oil market. There were expectations that the oil to be produced in the Caspian region would compete with or even substitute for the oil from the Middle East. However, early optimism was premature. After an 8-year delay, when Kashagan oil was announced to have started flowing on Sept. 11, 2013, there was again disappointment. Production had to cease because of technical problems. More years will be required before oil production from Kashagan reaches peak levels. Questions have been raised about the commercial viability of the project for foreign investors.
There was similar industry experience when Saudi Arabia rapidly expanded its oil production capacity in the early 1970s. In spite of benefiting from the operational expertise of major oil companies (the Aramco partners), some reservoirs suffered from unplanned pressure decline. Free gas was developing in the reservoirs near producing wells and there was failure in some surface facilities such as stabilizer plants, pumps, and other equipment that caused short-term production stoppages of 1-2 million b/d.
Maintaining production of an oil company or province requires continuous investment and field operations. Otherwise, production capacity declines. Production of Saudi Arabia, for example, was about 10 million b/d in 1979-80. However, with the collapse of demand for OPEC oil in the 1980s and in order to defend the price of oil, OPEC began to reduce members' production. Saudi Arabia, acting as the swing producer, made the largest production cut. Its output gradually fell to about 3 million b/d by mid-1985 before rising to about 6 million b/d in 1989. In that decade, many surface production facilities were mothballed, and with demand for Saudi oil declining, the level of investment in exploration and production was reduced.
Following the occupation of Kuwait by Saddam Hussein's army in August 1990 and the imposition of international sanctions on Iraqi and Kuwaiti oil, more than 4 million b/d of supply disappeared from the world oil market. Saudi Aramco immediately commenced an unprecedented field operation to demothball the facilities and increase Saudi oil production. This was an exceptional industry achievement. However, the maximum production that could be reached was 8.5 million b/d, indicating that the kingdom's production capacity had declined by 1.5 million b/d between 1980 and 1990. The decline was obviously the result of reduced field development and maintenance in that decade.4
The price collapse
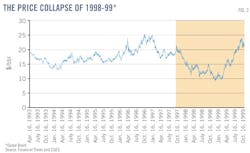
Shortage in the early 2000s had been accentuated by the impact of the oil price collapse at the end of the 1990s. After fluctuating around $20-25/bbl, the oil price fell more than 50% and was at times below $10/bbl in 1998-99 (shaded area, Fig. 3). The price collapse was partly instigated by OPEC's decision in Jakarta late in 1997 to raise oil production ceilings at the beginning of 1998, made just before the start of a severe recession in the Far East that lowered oil demand. Lower demand and increased supply led to a slump of almost 2 years in the price of oil. It was a severe blow to the global oil industry and caused an international crisis with massive staff reductions and project delays and cancellations.
The market was finally brought under control by realities of the need for oil revenue in oil-exporting countries and, more importantly, by geopolitical factors. For example, pressure from the US forced confidential meetings of ministers from one non-OPEC producer (Mexico) and two OPEC producers (Saudi Arabia and Venezuela). Saudi Arabia and Venezuela agreed to end their stand-off.5 6 Nevertheless, with the extra supply and large volumes in inventories, it took almost 2 years before excess oil could be diminished and price could return to its precrisis level.
The 1998-99 price slump reduced the oil industry's revenue and cash flow and forced companies to produce oil at the lowest possible cost and to delay or cancel many exploration and development projects. These measures severely impacted oil supply and caused a decline in production in 1999 and a slowdown in the growth of oil production in later years. In other words, world oil supplies were much lower than had previously been expected for the 2000s.
Besides lowering cash flow, the price collapse influenced the industry's outlook for the future of oil. In places, the assumption strengthened that a paradigm shift had occurred in the oil market and that the slump might continue for many years. Some serious analyses (for example, a March 1999 article in The Economist) even argued that $5/bbl was the sustainable future price of oil. These views darkened the outlook of industry decision-makers and investors in exploration and development. Low cash flow due to the low price and general pessimism cut investment and forced the industry to confine production to low-cost areas where development and production could be profitable with oil prices of $10/bbl. Obviously, such areas were and are scarce in the world, and most are not open to international oil companies. Companies in the first half of the 2000s delayed work in high-cost areas such as the Arctic, ultradeep water, high-pressure/high-temperature fields, low-permeability reservoirs, and small discoveries.
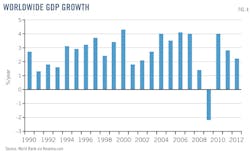
Even after the oil price rose to about $25/bbl in late 1999 and early 2000, oil company managers who had lost confidence in the oil market remained wary about another market collapse and delayed exploration and production investments. The outcome of all this was a slowdown in upstream projects and in the growth of oil supply. At the same time, the world economy was growing rapidly. The annual growth rate of global gross domestic product doubled in the first half of the 2000s and required more oil, but supply was not keeping up with demand (Fig. 4). It was in the second half of the 2000s that the industry gained sufficient confidence to increase investment and undertake high-cost projects.
Supply-demand imbalance
Briefly stated, world oil supply could not grow fast enough to keep up with growth in world oil demand in the first half of the 2000s. This was the main reason for the rise in the price of oil.
Problems cited earlier in the achievement of specific production targets imply practical limits on growth in exploration, development, and production in any oil province. The same limitation applies globally. World oil production cannot be increased overnight. Moreover, exploration and development in the 2000s had been slowed by the 1998-99 collapse in the price of oil.
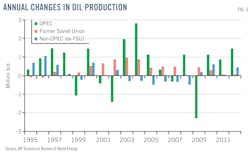
Fig. 5 shows that oil production in non-OPEC regions declined every year from 2003 to 2008 and that any notable rise in production in this period was from OPEC and the Former Soviet Union. OPEC's production management is limited to crude oil. Natural gas liquids and other liquid hydrocarbons are excluded from the OPEC production ceiling and individual country quotas. Data in Fig. 5 include liquids in addition to crude oil. However, the crude data are broadly similar and in line with the general conclusions discussed here; for brevity, they are not given separately.
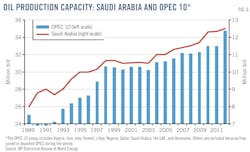
Data for oil production capacity of OPEC 10 countries and of Saudi Arabia alone are shown in Fig. 6. The OPEC data are for 10 members—Algeria, Iran, Iraq, Kuwait, Libya, Nigeria, Qatar, Saudi Arabia, the UAE, and Venezuela—to avoid distortions in the data series by membership changes over the period.
As already noted above, Saudi Arabia increased production to its maximum capacity of 8.5 million b/d by end-1990-early 1991. The kingdom continued increasing its production capacity in the 1990s—to about 10 million b/d in 1997 and 10.7 million b/d in 1998. However, Saudi capacity did not increase or in fact marginally decreased during 1999-2003.
The argument might be made that OPEC and Saudi Arabia should have continued expanding oil production capacities in the years after the 1998-99 oil price collapse and that in the first half of the 2000s, they should have supplied more oil to the market. In that case, the price of oil would not have reached $145/bbl in July 2008. It also might be argued that OPEC countries, as members of an organization dedicated to market stability, should have continued investing and expanding capacity in preparation for future market tightness.
These criticisms would represent wisdom after the event. Like the rest of the oil industry, OPEC members did not expect the market to tighten so soon. Gripped by the pessimism of the first half of the 2000s, all companies had reduced their operations and worked little to expand oil production capacity. Still, after the 1993-2003 pause, Saudi Arabia resumed its capacity increase—to about 11 million b/d in 2004 and 12.5 million b/d in 2012 (Fig. 6).
Suppressing overall OPEC supply during the period in question was the sharply reduced oil production in Iraq, caused by sanctions imposed in the 1990s, physical damage to oil installations during military campaigns up to Saddam Hussein's fall in 2003, and institutional failure and lack of security in the country after 2003.
While supply stagnated from underinvestment and inherently long lead times of field operations, the global economic growth rate doubled during the first half of the 2000s to 4%/year (Fig. 4). Demand for oil quickly strengthened from what economists call the income effect.
A widening gap appeared between the need for oil and what was available.
The Chinese factor
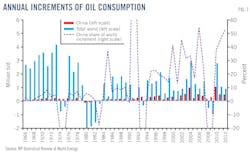
As shown in Fig. 7, China has been the main driver of strong growth in global oil demand since 2000. During most of the 1980s and 1990s, the Chinese share of annual demand growth was only a few percentage points. At times in the 2000s, the share has exceeded 50%.
During the economic boom—or financial bubble—of the West, China was the main supplier of cheap goods and products. Huge investments were made in China for manufacturing and producing products intended for export. This partly explains the rapid rise in Chinese oil consumption.
An interesting question has arisen whether China also was the main driver of the world demand for commodities in general and whether China might explain the commodities super-cycle of strong demand and rising prices that lasted more than 10 years. Since the global financial crisis of 2008 and the financial and economic problems in the US and Europe, these countries have reduced their imports from China. In spite of the Chinese government's policy of encouraging domestic consumption, there has been a slowdown in the export-oriented Chinese economy.
This can in turn explain the decline in the price of commodities, though the price of oil is still high.
Plotting the imbalance
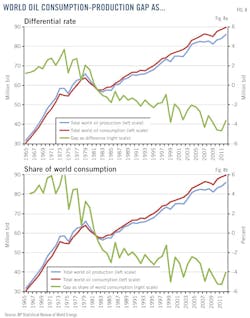
The world's oil supply-demand imbalance can be observed from examination of a simple graphical presentation of the world's historical oil production and consumption (Fig. 8). The absolute values of the production and consumption curves are not comparable due to differences in the sources of information, definitions, conversion factors, and other disparities. This is in spite of the fact that the data are systematically compiled by BP staff, cross-checked, and revised every year. Relative variations over time clearly illustrate a widening gap between supply and demand in the mid-2000s. Oil consumption was increasing faster than oil production, and the gap increased by about 2 million b/d (more than 2% of world oil consumption) over the first half of the 2000s. This widening gap was the main factor in the steep rise in the price of oil over that period.
Many oil market participants and financial players had begun to believe that the international financial and economic boom and the rise in the price of oil would continue. Many took speculative positions in the oil market, making the price of oil rise even further than was justified by the supply-demand gap. Few accepted the idea of a financial bubble encouraged by irrational exuberance. Most feared that oil demand would continue to exceed oil supply for many more years. Their view was amplified by proponents of the peak-oil theory, who had become more outspoken with the rising price of oil and were influencing perceptions in the market.
The market since 2008
The world financial crisis in 2008 severely damaged the global economy (Fig. 4) and caused an actual decline in world oil consumption (Fig. 7) and a drastic fall in the price of oil (Fig. 1). With the collapse in demand, the price of oil, which had reached its highest level ($145.40/bbl for Dated Brent) on July 3, 2008, fell to nearly $30/bbl by the end of that year. OPEC members had to cut production drastically in the second half of 2008 and in 2009 to make the price of oil rise again. The price passed the $100/bbl level early in 2011.
The annual increase in world oil consumption was 1 million b/d or less in 2011 and 2012 (Fig. 7). The large increase in 2010 was due to the negative values in 2008 and 2009.
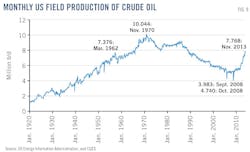
Since 2011, the price of oil has remained in the $100-120/bbl range, supported by a tight balance between global flows of world oil supply and world oil demand, as well as other parameters such as oil inventories, spare oil production capacity, and the market's perception of the global economy, supply-demand trends, OPEC policy, and political risk. An important market parameter again has been that supply has been lagging behind demand. This was in spite of a more than 3.5 million b/d increase in crude oil production in the US since 2008 (Fig. 9). The increase had not been foreseen by most observers.
The US reached its peak production in 1970, and its oil output had been declining since then until the reversal of the trend and the start of an increase in recent years. The assumption has always been that no more oil could be found after more than a century of industry operations in the US, where the latest technology has been utilized in an open-market environment with little constraint on investment and access to land. Nevertheless, the application of new technology such as hydraulic fracturing of wells drilled horizontally into subsurface shale and tight formations by entrepreneurs and small, aggressive companies opened a new concept for producing gas and oil. Major companies have since followed the trend.
The increasing US production contributed to the reversal of non-OPEC production, which had been declining in most of the 2000s (Fig. 5). Nevertheless, in other parts of the world, oil supply has been constrained and has been suffering from delays and disruption due to political turmoil—such as in Libya, Iraq, Nigeria, Yemen, Sudan, and Syria—imposed sanctions on producing countries such as Iran, and technical supply problems in other producing regions. As shown in Fig. 5, in spite of the political disruptions and sanctions imposed on some members of OPEC, the organization's total production increased by about 1 million b/d/year during 2010-12. There were small increases in non-OPEC regions in 2010 and in 2012, while the production increase in the Former Soviet Union was even smaller.
Next: How these relationships might shape oil prices of the future (May 5).
References
1. Takin, M., "Upstream costs—Do they justify high oil prices?" Centre for Global Energy Studies Special Study, pp. 1-130, 2012.
2. Takin, M., "Brazil reopened—Do we expect too much oil too soon?" Centre for Global Energy Studies Executive Report, pp. 1-17, 2013.
3. Takin, M., "Iraq's future oil production," Centre for Global Energy Studies Quarterly Oil Supply Report, December pp. 13-18, 2010.
4. Takin, M., "Oil Production Capacity in the Gulf, Vol. II, Saudi Arabia," Centre for Global Energy Studies, pp. 1-258, 1993.
5. Takin, M., "The Riyadh-Vienna decisions of 1998 and the world oil market," Middle East Executive Reports, Vol. 21, No. 3, pp. 8, 20-23, Mar. 1998.
6. Takin, M., "Prospects after the Riyadh agreement," Petroleum Review, Vol. 52, No. 618, pp. 37-39, July 1998.
The author
Manouchehr Takin has been with Sheikh Zaki Yamani's Centre for Global Energy Studies in London since it was established in 1990, examining technical and economic aspects of the world oil supply and demand, OPEC policy, investments, the Middle East, the North Sea, the oil services industry, production costs, and other topics. Before joining CGES he worked for 9 years at the OPEC Secretariat in Vienna.
Earlier, he worked as a geologist, geophysicist, reservoir engineer, exploration manager, and manager of exploration and production research with Iran's International Oil Consortium, Amoco, Ultramar, National Iranian Oil Co., and Shell, as well as the Geological Survey of Iran and Anglo American/Charter Consolidated.
Takin obtained his BSc Honors degree in geology from Manchester, PhD in geophysics from Cambridge, MBA from Industrial Management Institute Tehran. He also conducted research at Lamont Geological Observatory of Columbia University New York. He can be reached at [email protected]. His views in this article are his and do not represent any official position of CGES, operations of which ceased on Mar. 31.
