HAYNESVILLE UPDATE—4: Haynesville outlook hinges on gas price
Mark J. Kaiser
Yunke Yu
Louisiana State University
Baton Rouge
The future of Haynesville production is unforeseeable, yet trends can be postulated for a range of drilling scenarios.
In this final installment of a four-part series analyzing the Haynesville, we rely on data presented in the first three parts to extrapolate potential short and long-term production outcomes for the play (OGJ, Dec. 2, 2013, p. 62); Jan. 6, 2014, p. 54; Feb. 3, 2014, p. 22). If commodity prices remain low for a sustained period of time, Haynesville production will continue to fall amid poor comparative economics. A sustained increase in gas price will allow drilling and production to recover, but the magnitude and speed of the rebound is uncertain. We characterize trends using a canonical model to provide insight into the range of possibilities.
Drilling scenarios
Drilling scenarios are defined by C= completions/year scheduled uniformly throughout the year; period T during which drilling occurs, referred to as the drilling period; and P50 average profiles describing the expected production/well that is brought online.
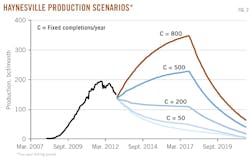
For the historical period, the number of completions/year is known; in the future, C is unknown and assumed. For future periods, we assume C completions/year over the drilling period T and schedule the completions on a uniform monthly basis. The number of completions/year is represented by parameters of C = {50, 200, 500, 800} and the period of drilling is assumed to be T = {5, 10, 15} years.
Well production/completion in the historical period 2008-12 is assumed to follow the average profile for all wells completed and producing during each year. For the historical period, P50 is known (OGJ, Dec. 2, 2013, p. 62); in the future, P50 is unknown and assumed. Wells drilled and completed in 2013 and beyond are assumed to follow the 2011-12 average production profile.
Fifty completions/year are considered a lower bound of activity to maintain leases and drill the best locations; 400 or more completions/year will require sustained high gas prices. Actual drilling levels are likely to fall between these two bounds for the foreseeable future constrained by the expected return on investment (OGJ, Feb. 3, 2014, p. 22).
When prices are low, fewer completions are likely, and as prices increase, more wells will be drilled and completed. No new completions (C = 0) corresponds to the inventory of Haynesville wells first-quarter 2013 and assume no additional capital expenditures.
Calibration
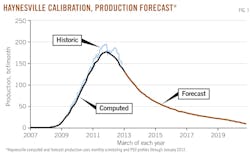
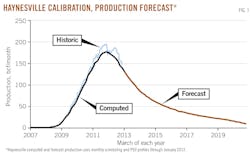
The number of historic completions is known and scheduled monthly with historic P50 profiles during 2008-12 (Fig. 1). The model output demonstrates that production computed under the simplified completion schedule and average profiles reliably recreates the rise and fall of Haynesville production over the historical period.
No new wells
Incrementing the time parameter on each well of the calibration model allows future production to be extrapolated based on the current inventory of wells (Fig. 1). The forecast is the best estimate of future production arising from the March 2013 inventory of producing wells assuming no additional capital expenditures or significant changes in operating practices.
Production declines quickly in accordance with the nature of the average Haynesville well. If no new wells are drilled and brought online, regional production will result in an estimated 13.9 tcf of gas through 2020.
Production forecast
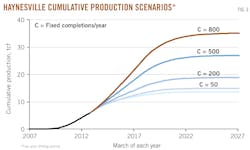
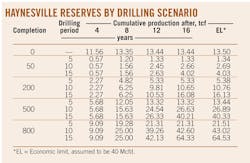
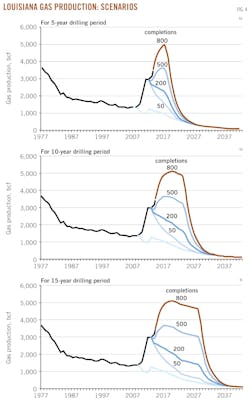
If 50 wells/year are completed for the next 5 years, an additional 1.3 tcf production will build out reserves to 15.2 tcf by 2030 (Table 1; Figs. 2 and 3).
If 200 wells/year are completed for the next 5 years, an additional 5.3 tcf production will build out reserves to 19.2 tcf by 2030, but production will still not return to its recent peak.
If 500 wells/year are completed for the next 5 years, an additional 13.4 tcf reserves will arise, leading to a cumulative build out of 32 tcf by 2030 and growth in production.
Manuscripts welcomeOil & Gas Journal welcomes for publication consideration manuscripts about exploration and development, drilling, production, pipelines, LNG, and processing (refining, petrochemicals, and gas processing). These may be highly technical in nature and appeal or they may be more analytical by way of examining oil and natural gas supply, demand, and markets. OGJ accepts exclusive articles as well as manuscripts adapted from oral and poster presentations. An Author Guide is available at www.ogj.com, click "home" then "Submit an article." Or, contact the Chief Technology Editor ([email protected]; 713/963-6230; or, fax 713/963-6282), Oil & Gas Journal, 1455 West Loop South, Suite 400, Houston TX 77027 USA. |
Model sensitivity
As the drilling period expands or contracts, production will change proportionally, relative to the duration of drilling and number of completions performed (Table). As the drilling period increases, the total number of completions will increase linearly, increasing cumulative production and reserves (Fig. 4).
For 500 completions/year, a 5-year drilling period will result in an additional 13.4 tcf reserves to the current well inventory, while a 10- and 15-year drill period will result in two and three times these volumes, or 26.9 tcf and 40.3 tcf, respectively.
For a 5-year drilling period, 50 completions/year would result in a 1.3 tcf reserves build out, while 200 and 500 completions/year result in four and ten times the reserves volume, or 5.4 and 13.4 tcf reserves build out, respectively.
Outlook
Economic obstacles to long-term, sustainable development in the Haynesville are high drilling and completion costs and the lack of a liquid uplift; advantages of the play include high production rates and good recovery volumes, regionally concentrated sweet spots, and high-density infrastructure with industries that can transport and consume the product. Production in the Haynesville will bound by the scenarios constructed.
CorrectionIn "HAYNESVILLE UPDATE—2: North Louisiana drilling costs vary slightly 2007-12" by Mark J. Kaiser and Yunke Yu (OGJ, Jan. 2, 2014, p. 54), minor errors appeared in two figures. In the x axis of Fig. 6, the correct first increment is -10. In the legend of Fig. 8, the first element is <0. |
