Haynesville Update—3: Low gas price constrains profitability
Mark J. Kaiser
Yunke Yu
Louisiana State University
Baton Rouge
The challenge in all unconventional plays is not to find the deposits but to find the areas that are economically viable and will lead to the best production and recovery volumes at a rate of return that satisfies investor requirements. Cheap credit, irrational exuberance, and risk-prone behavior have played roles in the investment decisions of Haynesville operators, but more work needs to be done to sustain production in the region and make the play more efficient and successful to attract capital.
This is the third in a series of four articles on the Haynesville shale. Parts 1 and 2 focused on the production decline within the last 2 years and historic well construction costs (OGJ, Dec. 2, 2013, p. 62; OGJ, Jan. 6, 2014, p. 54). This part discusses well economics and the overall profitability for Haynesville wells.
We based our calculations on public data from the Strategic Online Natural Resources Information System (SONRIS) – a database maintained by the Louisiana Department of Natural Resources (DNR). In addition, we drew well cost data from Louisiana tax records as outlined in Part 2.

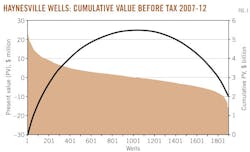
Cumulative before-tax present value of producing Haynesville wells is about $2 billion (Fig. 1). After taxes, the cumulative present value is -$2.2 billion. The Haynesville play is profitable on a before-tax basis, but the economics are difficult and the sustainability of the play remains uncertain.
The average Haynesville well is expected to generate $1.1 million before taxes during its lifetime, but after taxes, the average Haynesville well destroys value. Most operators have reduced their development cost over time through drilling efficiencies and technical innovation, but additional cost reductions or a more favorable price environment will be needed if operators are to extract value out of the play.
In 2012, about 600 bcf proved developed reserves and 6.6 tcf proved undeveloped reserves were impaired/downgraded due to low gas prices and revisions in production forecasts.
MODEL ASSUMPTIONS |
Profitability calculations are closely connected to model assumptions. Before and after-tax present value was estimated based on well cost data, production forecasts using traditional decline curve methods, Henry Hub spot prices, and historic realized (hedged) gas prices when reported. Spud date served as time zero in all calculations. Future gas prices and operating cost are assumed flat at $4/Mcf and $0.25/Mcf, respectively, and a 25% royalty rate, 10% discount rate, and a 30% federal tax rate was applied. Severance tax rate depends on gas price and the state severance tax exemption was included in the assessment. Intangible assets were assumed to account for 50% total capital expenditures. Tangible assets were depreciated over 60 months. Lease costs, general administration, and inflationary effects were not considered. |
Correlations
Capital investment transforms reserves into production via wellbores, and for most plays there is usually a strong correlation between reserves, production, and producing wells during the early development phase.

Haynesville production correlates closely with the number of active wells, and operator reserves correlate with production (Fig. 2). Producers with the best wells and youngest inventories rise above the industry average and include EP Energy Corp., Exco Resources Inc., QEP Resources Inc., Petrohawk Energy Corp., and Swepi LP.
Reserves and production show variation because of differences in formation characteristics, completion strategies, and forecast procedures employed by operators. As the Haynesville play matures and wells move down their decline curves, the inventory of idle wells will increase, well portfolios will become more variable, and correlations will weaken. For now, however, the relations remain strong because the play is still in the early stages of development.
Reserves disclosures
Operators working the Haynesville reported 20.7 tcf proved reserves and 10.1 tcf proved developed reserves on Dec. 31, 2011. On Dec. 31, 2012, operators reported 11.4 tcf proved reserves and 7.4 tcf proved developed reserves, according to US Security Exchange Commission's 10-K and company shareholder annual reports. Most companies did not consider the Haynesville significant in 2012, and only EP Energy and Comstock reported Haynesville proved undeveloped (PUD) reserves, which required us to make gross assumptions in estimation.
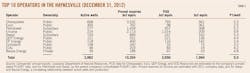
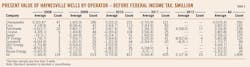
The top five operators in 2012 were Chesapeake Energy Corp., Exco, Petrohawk, Encana Corp., and Swepi, and together they produced 77% of production and reported 8.6 tcf proved reserves (Table 1). The top 10 operators in the Haynesville held 92% of the total proved reserves in the formation and produced almost all of its production.
On Dec. 31, 2012, Chesapeake reported 3.5 tcf proved reserves in the Haynesville from 668 active wells, or on average of 5.3 bcf/well. Swepi's and Petrohawk's reserves per active well are consistent with our previously reported 5.8 bcf/well regional estimates (OGJ, Dec. 2, 2007, p. 62).
Exco is conservative in its reserves reporting or is drilling in less favorable locations (2.5 bcf/well). QEP Energy, EP Energy, Comstock, EOG Energy, and Beusa Energy all report reserves less than 5 bcf/well. Encana's reported average recovery per wellbore falls on the high end of the spectrum at 9.4 bcf/well.
Chesapeake, EOG, and Swepi average estimated ultimate recovery (EUR) calculations for all wells that started production during 2009-12 compare favorably with reported values (Fig. 3). Encana and Beusa Energy reported significantly greater wellbore reserves relative to our estimated values; Exco, Petrohawk, QEP Energy, and EP Energy appear more conservative in their reserves estimation.

Development cost
Development cost is a useful and oft-cited performance measure that indicates the capital efficiency and profit potential of an operator in a given region over a specific period of time. Development cost is not a direct measure of profitability but is usually a reasonable indicator of efficient and profitable operations.
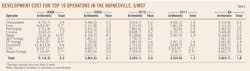
In 2008, Chesapeake's total estimated development cost for all wells drilled in the Haynesville averaged $3.4/Mcf, which fell to $2.3/Mcf in 2009, $2.2/Mcf in 2010, and $1.9/Mcf in 2011 (Table 2). Chesapeake's aggregate average development cost from 2008-11 was $2.2/Mcf.
QEP Energy and Exco achieved $1/Mcf total development cost from 2008-11, followed by EP Energy ($1.4/Mcf), Petrohawk ($2/Mcf), Encana ($2.1/Mcf), Chesapeake ($2.2/Mcf), and Swepi ($2.5/Mcf). EOG and Beusa Energy realized aggregate total development costs over $3/Mcf (Fig. 4).

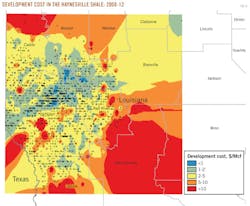
Sweet spots in the formation have achieved development cost less than $1/Mcf, but most swathes are higher cost areas (Fig. 5). Commercially viable locations appear concentrated and limited in areal extent.
Profitability
The present value of Haynesville wells indicates significant variation on both sides of zero in the before- and after-tax assessment. On a before-tax basis, about half of the well inventory are expected to realize a positive present value during their lifetime (Fig. 6); after-tax, less than one third of wells are expected to create value.

The average present value of Haynesville wells before-tax is estimated at $1.1 million/well; after tax, the average present value is -$1.3 million/well. Standard deviations are significant in both assessments, indicating wide spreads around the mean, and significant performance risk.
Winners, losers
Operators with the lowest development cost have created the most value from the play (Table 3, Fig. 7).
For 2008-12, EP Energy realized an average $5.8 million/well before taxes, followed by QEP ($4.4 million/well), Exco ($3.8 million/well), Petrohawk ($3.2 million/well), and Encana ($0.8 million/well). Chesapeake essentially broke even on a before-tax basis ($10,000/well).
EOG (-$1.2 million/well), Comstock (-$1.7 million/well), Swepi (-$2.5 million/well), and Beusa Energy (-$5.3 million/well) realized average negative present value before taxes.

On an after-tax basis, EP Energy ($2.5 million/well), QEP ($1.5 million/well), Exco ($0.8 million/well), and Petrohawk ($0.2 million/well) achieved positive value. After-tax losers include the rest of the operators: Encana (-$1.5 million/well), Chesapeake (-$2 million/well), EOG (-$2.4 million/well), Comstock ($-3.1 million/well), Swepi (-$4.2 million/well), and Beusa Energy (-$6.1 million/well).
Sweet spots
Local pockets exist where favorable geology, cost controls, and management experience combine to create value, but there is no guarantee that nearby areas will create similar value or that new wells in the same area will continue to generate value. Resource plays are frequently referred to as marginal operations because of these characteristics, and operators need to continually innovate and reduce costs to maintain commercially viable operations.
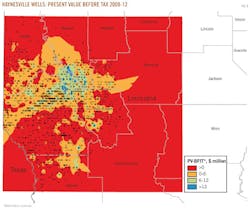
On an aggregate regional basis, Bossier ($3.5 million/well), DeSoto ($1.4 million/well), Caddo ($1.2 million/well), Bienville ($0.6 million/well), and Red River ($0.4 million/well) were the best parishes to drill before tax (Fig. 8). After tax, the only parish where the average well is expected to turn a profit is Bossier ($0.5 million/well). All other parishes on an after-tax basis yield average negative present values.