Real-time monitoring improves LNG inventory measurement
Sung Baek Hong
Kogas
Daegu, South Korea
Kogas has improved the calculation method for determining stocks at its LNG terminals, changing from a sampling method to a real-time monitoring system using a level, temperature, and density meter installed in the tank. The switch has made storage calculations more accurate, simplified the calculation process, reduced human error, and increased data reliability. It has also improved calculation of gas caloric value and therefore billing.
Kogas operates 4,108 km (2,500 miles) of trunkline nationwide at a pressure of 70 kg/sq cm. The company also operates four LNG regasification terminals: Incheon and Pyeongtaek on the west coast, Tongyeong on the southern end of the peninsula, and the most recently added, Samchoek, commissioned in June on the east coast.
Kogas has 63 LNG tanks nationwide, totaling 9.46-million cu m of storage. Japan imports more LNG than Korea, but the volumes are brought in by a variety of companies. Kogas, with a natural gas distribution monopoly in Korea, imports and stores more LNG than any other single company, supplying 17 power plants and 31 distribution networks.
Fig. 1 shows Pyeongtaek LNG terminal and its 23 storage tanks.
Unaccounted for gas
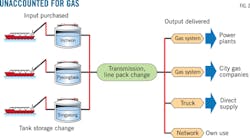
Fig. 2 shows the total amount of LNG purchased as input and the total LNG sales as output. Unaccounted-for gas is the difference between input and output. From this we can calculate the rate of loss by applying LNG storage change and line pack change. The category of LNG sales includes supplies to power plants, city gas companies, direct consumers, and Kogas's own uses.
The amount of LNG in storage affects unaccounted-for gas, making accurate measurement of LNG storage in tanks an important factor.
Portion of unaccounted-for gas (UAG %) = [1 - amount delivered/amount purchased] × 100.
Purchased gas = LNG/LPG + gas unloading + tank storage changes + third-party inputs + line pack changes.
Delivered gas = power plant deliveries + city gas company deliveries + gas loading + LNG truck loading + own-use gas + mother station + third-party output + test operation and commissioning consumption + venting.
Sampling procedures
There have been two generally used sampling procedures to calculate density and calorific value (CV) of LNG in storage. The first calculates the volume and gas CV of LNG unloaded from ship's tanks to storage tanks in terminal. The second calculates the volume and gas CV of LNG discharged from storage tanks to the sendout pipeline.
For the first process the sampling device should include a vaporizer and the sampled gas should be aggregated in the gas holder while LNG is being unloaded from the carrier's tanks to sample LNG from the unloading pipeline. The aggregated samples then move to three gas bottles for analysis by chromatograph. Compositional analysis of the sample confirms loading data and determines total calorific value for invoicing.
This procedure has no problems because the seller and buyer have agreed to the sampling and calculation procedure.
The second process involves calculating the amount of LNG in storage. LNG in a tank should pass through an LNG pipeline, with samples drawn from this line before transfer to the transmission line.
LNG vaporization should occur before sampling and passage through the pressure regulator. The operator stores this sampled gas in bottles and transports them to the chromatography lab. The operator then analyzes its composition, determines the density of the sampled gas, and calculates the CV and volume of gas.
The sampling process takes at least 1-2 hr/tank, with analysis needing more than 5 hr/tank.
Kogas, however, had problems with this sampling procedure:
• Gas sampling results depended on the staff's proficiency.
• The daily, monthly, and yearly sampling workload was burdensome.
• Sampled gas sometimes did not indicate representative CV and density because the primary pump discharged from the bottom of LNG tank.
• The operator couldn't sample the tank's LNG during unloading due to a mixing problem.
• In July 2012 regulations changed the sales unit for custody transfer from cubic meters to megajoules, requiring the measurement of storage be changed from a volumetric to a calorific unit.
• LTD meters were not calibrated because there are no density calibration facilities in Korea. Calibration is very expensive and less accurate if liquid nitrogen is used.
These factors prompted Kogas to change sampling and analysis for density determination to real-time calculations in 2012.
New method
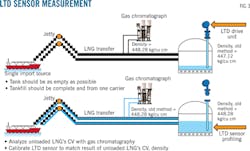
Kogas has consistently tried to improve LTD's calibration. Engineers suggested that LNG unloading data regarding density and CV could be used for calibrating in-tank LTD. The operations department, however, couldn't apply this method due to the difficulties of conducting a series of LTD tests while operating. But when the gas-sales unit change occurred, momentum began to build, leading to the new calibration method for LTD metering (Fig.3).
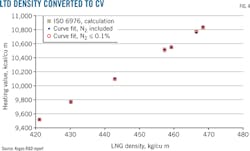
Before doing anything else operators emptied the tank as thoroughly as possible. They next unloaded LNG from a single carrier to refill the tank fully. Gas chromatography allowed analysis of the unloading LNG's CV and density and calibration of the in-tank LTD sensor to match the results of the unloaded LNG (Fig. 4). This matching allowed use of the LTD installed in existing tanks to calculate the quantity of LNG on hand via its density.
Kogas's R&D Center developed this calibration method using regression analysis in 2007 (Fig. 4). LNG's very low nitrogen content allows conversion of its density into calorific value within the very small error range seen in Fig. 4, clearing the way for application of this method across the Kogas system since 2013.
The author
Sung Baek Hong ([email protected]) is head of technology planning at Kogas, responsible for establishing and revising Kogas's in-house technical standards, mid- to long term technology strategy, and new technology applications He was previously in charge of the gas quality, flow measurement, and calorific value control of natural gas supply. Hong earned a BS (1985) in electrical engineering from Soong-Sil University, South Korea, joining Kogas's natural gas department after graduation, working in areas such as transmission pipeline construction, operation, maintenance, and corrosion control.


