Pipelines expand to meet NGL growth
Dan Lippe
Petral Consulting Co.
Houston
The first article in this new series on the US midstream industry trends and developments focused on historical production trends for US natural gas and crude oil, the importance of horizontal drilling and hydraulic fracturing, and the impact on US gas plant NGL production (OGJ, June 2, 2014, p. 92). This series of articles will continue to provide updates on regional trends in US gas plant production and demand in key NGL markets including exports.
This and future installments in the series will provide an overview of the expansion of all the major components of NGL infrastructure since 2009.
Before 2009, midstream companies made relatively modest capital investments in NGL infrastructure. The industry’s capacity for raw mix pipelines, NGL fractionation, distribution system pipelines, and import-export terminals was nearly constant for the previous 20 years or more.
As growth in crude oil and associated gas production began to increase modestly during 2009-11 and then at unprecedented rates since 2012, midstream companies began expanding capacity of all elements in NGL distribution to try to keep up with the accelerating growth in NGL raw mix production.
NGL raw mix production
Gas plant NGL production is behind midstream’s boom in infrastructure capacity expansions. Accelerating growth in crude oil production and in associated gas production has prompting the rapid growth in gas plant NGL production since 2011 (Table 1).
Associated gas production
NGL recovery via processing associated natural gas (and unconventional sources of NGL-rich gas) has been the primary source of growth in overall NGL raw mix production since 2010. The US Energy Information Administration (EIA) changed the definition of associated gas production in its annual natural gas statistics. EIA now includes all gas produced from any shale formation in a new category called “shale gas wells.” While analysts may estimate how much associated gas production is contained in this category, such estimates are no substitute for accurate production statistics obtained from producers.
Shale formations have been an important source of growth in crude oil production and associated gas production (or NGL rich gas), but EIA’s decision to discontinue its historical breakout of associated natural gas production has degraded the value of EIA’s natural gas statistics in NGL supply analysis. Fortunately, oil and gas commissions in some key states continue to require producers to provide details of natural production based on traditional categories.
Texas Railroad Commission (TXRRC) statistics for 2006-09 showed associated gas production in Texas increased by 30-60 MMcfd, and growth rates accelerated to 331 MMcfd/year in fourth-quarter 2010 and 624 MMcfd/year in fourth-quarter 2011. Associated gas production increased by 1 bcfd/year during fourth-quarter 2012 through second-quarter 2013.
Based on growth in associated gas production alone and an NGL content of 6.5 gal/Mscf (GPM), gas plant NGL production in Texas would have increased by 157,000 b/d in 2012 and 145,000-155,000 b/d in the first, second, and third quarters of 2013. EIA gas plant NGL production statistics showed production increased by 206.500 b/d in 2012 and 175,000-225,000 b/d in the first, second, and third quarters of 2013.
Year-to-year growth in NGL raw mix production in Texas slipped to 118,600 b/d in fourth-quarter 2013, according to EIA statistics. Based on TXRRC statistics for associated gas production, estimated growth in NGL raw mix production declined to 93,200 b/d. Based on comparison of actual and estimated growth in gas plant NGL production in Texas, Petral concludes TXRRC statistics for associated gas production are a reasonable alternative to EIA statistics. Since EIA has discontinued collecting statistics on associated gas production, the use of state agency statistics and historical gas-to-oil ratios are reasonable alternatives.
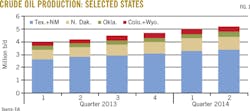
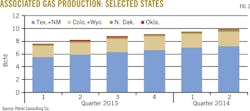
Based on historical gas-to-oil ratios (associated gas production), Petral estimates for 2013, compared with those for 2012, show associated gas production increased by 150-175 MMcfd in Oklahoma, 125-175 MMcfd in New Mexico, 350-375 MMcfd in Colorado-Wyoming, and 200-225 MMcfd in North Dakota (Figs. 1 and 2).
NGL raw mix production
For 1992-2008, EIA statistics show NGL raw mix production from US gas processing plants averaged 1.78 million b/d. During 2009 through first-half 2014, gas plant NGL supply increased by 1.06 million b/d (65.6%). Never before in the history of gas processing had US NGL production increased by 1 million b/d within a 5-year period.
During 2012-14, gas processors curtailed ethane production by shifting gas plants into ethane-rejection mode. Petral estimates ethane production curtailments reduced total NGL production by 150,000-300,000 b/d since second-quarter 2012.
Also according to EIA statistics, US gas plant NGL production in second-quarter 2014 was 2.95 million b/d and crossed the 3.0 million b/d threshold in June 2014. Discussions with EIA personnel revealed that delays in capturing NGL production at new gas plants in Ohio resulted in an understatement of NGL production in the Midcontinent January-May 2014; production may have been 3.0 million b/d a few months earlier.
US NGL production in second-quarter 2014 was 229,300 b/d more than in first-quarter 2014 and 309,900 b/d more than in second-quarter 2013. Based on a nameplate capacity of 75,000 b/d (the most common increment of new capacity in Mont Belvieu, Tex., since 2010), growth in US NGL production during first-half 2014 was sufficient to fill three or four new raw mix fractionation trains. A large share of US NGL raw mix production (usually 40-50%) finds its way to Mont Belvieu for fractionation.
In 2011 through first-quarter 2014, gas plants in the US Gulf Coast (primarily Texas and New Mexico) accounted for a disproportionate share of overall growth in US gas plant NGL production. In 2012, Gulf Coast NGL raw mix production increased by 176,200 b/d and accounted for 18% of growth in US production. In 2013, due to the decline in NGL production in the Rocky Mountains, gas plants in the Gulf Coast accounted for 95% of growth in US production. Production in the Gulf Coast increased by 128,400 b/d in first-quarter 2014 (48% of US production growth) and 193,300 b/d in second-quarter 2014 (47% of US production growth).
Gas plants in the Midcontinent also made steady contributions to growth in US NGL production. Production increased by 54,500 b/d in 2011 and accounted for 30.5% of total US production growth. That growth slowed to 33,000 b/d in 2012 and accounted for 14.8% of US production growth. Petral estimates ethane rejection in the Midcontinent was 26,500 b/d in 2012.
At full ethane recovery, NGL production in the Midcontinent would have posted an increase of 59,500 b/d in 2012. As ethane rejection became more widespread in 2013, year-to-year growth in NGL production in the Midcontinent slipped to 23.700 b/d, and the Midcontinent accounted for only 13% of growth in US production.
Gas processors started up new gas plants in the Utica shale play in eastern Ohio in first-half 2014 and growth in NGL production in the Midcontinent accelerated to 33,600 b/d (11.6% of growth in US production) in first-quarter 2014 and production increased by 111,400 b/d (23.8% of US production growth) in second-quarter 2014. Based on EIA statistics for May compared with those for June, gas plants in Ohio produced about 80,000 b/d in June.
For all the publicity regarding its potential, NGL production from gas plants in the Marcellus shale made only minor contributions to growth in US NGL production until second-half 2013 and first-half 2014.
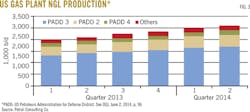
EIA statistics show increases in NGL raw mix production in the East Coast were 5,000-15,000 b/d/year during 2011 through first-half 2013. Gas plants in Marcellus began ethane recovery in fourth-quarter 2013, and NGL production growth rates accelerated to 54,000 b/d in fourth-quarter 2013 and were 104,900 b/d in first-quarter 2014 and 82.000 b/d in second-quarter 2014 (Fig. 3). Gas plants on the East Coast produced 166,000 b/d in first-half 2014 and accounted for 5.9% of US NGL raw mix production.
C2 rejection; NGL raw mix production
Spot prices in Mont Belvieu have been too weak to support full ethane recovery since second-quarter 2012, and ethane rejection has been widespread. Ethane production losses due to ethane rejection varied from quarter to quarter. Petral estimates ethane rejection on a regional basis by comparison of EIA gas plant ethane production statistics for each region each month to production levels for each region when recovery margins supported full ethane recovery.
For gas plants in the Rocky Mountains, Midcontinent, and Gulf Coast, this analysis is straightforward. For gas plants in such emerging regions as the East Coast (Marcellus) and North Dakota (Bakken), there is no historical ethane production baseline. For gas plants in these areas, Petral uses historical ratios of ethane to propane in established regions as the basis for estimating full ethane recovery.
Finally, Petral’s estimates exclude unrecovered ethane from the ethane-rejection analysis until infrastructure to deliver ethane to one or more ethylene plants is in place. Hence, Petral’s estimates of ethane rejection for 2012, 2013, and first-half 2014 excluded all unrecovered ethane in the East Coast (until fourth-quarter 2013) and North Dakota (until third-quarter 2014) from ongoing ethane-rejection analysis. Based on this methodology, Petral estimates rejection reduced total gas plant ethane production by 260,000-270,000 b/d in first-quarter 2014 and 265,000-275,000 b/d in second-quarter 2014 and rejection was about 20% of full recovery volumes.
NGL raw mix transportation costs for gas plants in the Rocky Mountains are higher than in the Midcontinent and Gulf Coast and ethane-recovery margins for gas plants in the Rocky Mountains have been too weak to support full recovery in every quarter since second-quarter 2012. As result, ethane rejection in the Rocky Mountains has been more pervasive and has had more impact on NGL raw mix production than in the other two well established regions.
Petral estimates ethane rejection in the Rocky Mountains was 95,000-100,000 b/d in first-quarter 2014 and 80,000-90,000 b/d in second-quarter 2014. Petral also estimates ethane rejection in the Rocky Mountains was 41% of total ethane rejection in first-quarter 2014 and 35% in second-quarter 2014.
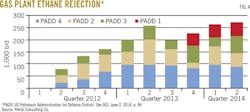
Enterprise Products Co. completed work on the ATEX Pipeline in fourth-quarter 2013 and enabled delivery of ethane production from Marcellus area gas plants to ethylene plants in the Midcontinent and Gulf Coast (OGJ Online, July 31, 2014). MarkWest and Sunoco Logistics also completed work on Mariner West and enabled delivery of ethane to ethylene plants in Sarnia (OGJ, Aug. 26, 2014). Petral estimates ethane rejection in fourth-quarter 2013 through second-quarter 2014 was 50,000-60,000 b/d and was 40-50% of full ethane-recovery volumes (Fig. 4).
NGL markets
Three markets account for more than 90% of US NGL demand:
1. Petrochemical feedstock.
2. Gasoline blending.
3. Retail space heating and internal combustion.
All five NGL components are used as feedstocks in petrochemical production, and normal butane, isobutane, and natural gasoline are used in gasoline blending. Retail space heating and internal combustion markets, however, consume only propane.
Of the three primary domestic end-use markets, only the petrochemical industry has the potential to continue to increase NGL demand in domestic markets, and growth in ethane demand for ethylene feedstock will result in growth in the petrochemical industry’s total NGL demand.
Petchem feedstock
The petrochemical industry is the largest of the three major NGL end-use markets, and the ethylene feedstock market is the largest segment of the petrochemical industry in terms of NGL consumption.
Petral Consulting estimates ethylene feedstock demand by direct contact with ethylene producers and based on production capacity for other industry segments. Other segments of the petrochemical industry include propane dehydrogenation (propane), methyl tertiary butyl ether (MTBE; normal butane and isobutane), and propylene oxide (isobutane).
Based on its monthly survey of ethylene plant operations and other key petrochemical facilities, Petral estimates total NGL demand in the petrochemical industry was 1.62-1.64 million b/d in second-half 2013, but demand slumped to 1.57 million b/d in first-quarter 2014 and 1.50 million b/d in second-quarter 2014.
The dip in NGL feedstock demand in first-quarter 2014 resulted from a reduction in ethylene production after 2 quarters of operating with almost no significant downtime for planned turnarounds or unplanned maintenance. In second-quarter 2014, planned turnarounds and maintenance problems further reduced ethylene production rates, and demand for NGL feedstocks fell 130,000 b/d below peak demand in fourth-quarter 2013.
Ethane accounted for 65-70% of total ethylene feedstock demand during 2013 and first-half 2014. Ethane demand broke the 1-million-b/d barrier in third-quarter 2012 and was 1 million b/d or more in 5 of 6 quarters during 2013 through first-half 2014. In second-quarter 2013, feedstock demand for ethane less than barely below 1 million b/d at 996,000 b/d.
Year-to-year growth in ethane demand was 84,500 b/d in fourth-quarter 2013 and 67,300 b/d in first-quarter 2014. In second-quarter 2014, the increase in ethylene production losses due to downtime for all reasons reduced ethane demand by 66,900 b/d, but demand posted a modest year-to-year increase of 26,900 b/d.
Historically, ethylene feedstock demand for propane varied as needed to maintain a reasonable balance in the US propane market. In first-half 2013, propane demand in the ethylene feedstock market was historically high and propane accounted for 28% of total petrochemical industry feedstock demand. The surge in propane demand in retail markets during winter 2013 dramatically demonstrated the importance of the ethylene industry’s feedstock flexibility.
Petral’s monthly survey of ethylene production and industry feedslates showed ethylene industry demand for propane was 331,000 b/d in fourth-quarter 2013 (95,400 b/d less than in first-quarter 2013) and 305,000 b/d in first-quarter 2014 (121,000 b/d less than in first-quarter 2013). After demand in retail markets fell to typical offseason levels, ethylene feedstock demand for propane recovered to 325,000-335,000 b/d in May and June 2014 (Table 2).
Refinery gasoline blending
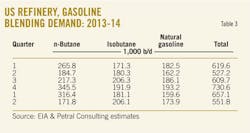
The refining industry is the second largest industrial-commercial market for NGLs, buying normal butane, isobutane, and natural gasoline for use in gasoline blending. As is true for retail market demand for propane, refinery demand for normal butane is strongly seasonal and demand for isobutane and natural gasoline is moderately seasonal.
Gasoline blending demand for normal butane reaches its seasonal peak during winter, but gasoline blending demand for isobutane and natural gasoline is usually at its seasonal peak in summer. Counter-cyclical demand for isobutane and normal butane offsets some of the strongly seasonal demand for normal butane. Demand includes refinery inputs of normal butane, isobutane, and natural gasoline (found in EIA statistics) and Petral’s estimates of demand by independent gasoline blenders, conversion of normal butane to isobutane, and use of normal butane and isobutane as feedstocks in MTBE plants.
EIA statistics and Petral estimates show demand for butanes and natural gasoline by refineries and independent gasoline blenders increased to a peak of 730,600 b/d in fourth-quarter 2013 from 527,200 b/d in second-quarter 2013. Consistent with the seasonal pattern, combined demand volumes fell to 657,100 b/d in first-quarter 2014 and 551,800 b/d in second-quarter 2014. Isobutane demand fluctuated within a range of 180,000-210,000 b/d during second-half 2013 and first-half 2014. Natural gasoline demand fluctuated within a range of 150,000-200,000 b/d during second half 2013 and first-half 2014 (Table 3).
Retail
Retail markets consume propane in four primary end-use segments:
1. Residential, commercial, and resellers (space heating markets).
2. Agriculture.
3. Motor fuel.
4. Miscellaneous industrial.
Of these four segments, consumption in the residential-commercial sector typically accounts for 75-80% of total demand in the retail market. Petral estimates propane demand in all end-use sectors increased to 755,000-770,000 b/d in fourth-quarter 2013 and 1.1-1.2 million b/d in January and February 2014.
Petral estimates retail propane demand during winter 2013 was 10-12 million bbl more than the 5-year average. Propane sales into retail markets always decline with warmer weather, and Petral estimates demand in second-quarter 2014 was 300,000 b/d.
NGL exports
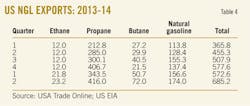
As US gas plant NGL production continues to grow at a record pace, US NGL producers and marketers and international buyers continued to increase LPG exports. US exports of propane and butane were 427,400 b/d in fourth-quarter 2013.
Due to the surge in retail propane demand and US wholesale propane prices during winter 2013, US LPG exports dipped to 394,300 b/d in first-quarter 2014 but jumped to 496,400 b/d in second-quarter 2014. US LPG exports were 102,100 b/d more than in first-quarter 2014 and 257,400 b/d more than year-earlier volumes.
US propane exports were 405,900 b/d (95% of total LPG exports) in fourth-quarter 2013 and dipped to 343,600 b/d (87% of total LPG exports) in first-quarter 2014 and were 62,200 b/d less than in fourth-quarter 2013. US butane exports increased to 50,700 b/d in first-quarter 2014 and 80,000 b/d in second-quarter 2014. The increase in butane exports in first-quarter 2014 offset about half of the quarter-to-quarter decline in propane exports.
Propane exports to destinations in the Western Hemisphere were 60% of total exports in fourth-quarter 2013 and 66% in first-quarter 2014. In second-quarter 2014, however, exports to Europe and northeast Asia recovered and were 37% of total exports while exports to destinations in the Western Hemisphere slipped to 63%. The diversity of destinations for US LPG exports continues a gradual increase (Table 4).
US ethane exports currently move exclusively to Canada. EIA recently developed a procedure to track US ethane exports (initially to Canada) and EIA statistics showed ethane exports were 20,000-25,000 b/d during first and second-quarter 2014. When Enterprise Products completes its ethane export terminal in the Houston Ship Channel, US will begin to export ethane to ethylene producers in Europe, India, and Asia in 2016 (OGJ Online, June 12, 2014).
NGL raw mix pipelines
In 2008, US midstream companies operated nine major NGL raw mix pipelines and three minor NGL raw mix pipelines.
Major NGL raw mix pipelines in service in 2008 were Mapco Rocky Mountain gathering system, Powder River Pipeline, Chevron West Texas gathering system, LDH West Texas raw mix pipeline, Seminole Pipeline, Chaparral Pipeline, EZ Pipeline, Panola Pipeline, and Medford gathering system. Minor NGL raw mix pipelines in service in 2008 were Wattenburg Pipeline, Dean Pipeline, and Tri-States Pipeline.
All major and minor pipelines except Wattenburg Pipeline, Tri-States Pipeline, and the Medford gathering system were in service to deliver NGL raw mix to storage and fractionation in the upper Texas coast. Wattenburg Pipeline transported small volumes of NGL raw mix from gas plants in eastern Colorado to Bushton, Kan. Medford gathering system transported NGL raw mix from gas plants in Oklahoma to the fractionator at Medford, Okla. And Tri-States Pipeline delivered NGL raw mix from gas plants in Mississippi and Alabama to storage and fractionation in Louisiana.
In early 2007, the combined capacity of gas plants originating in eastern New Mexico and West Texas was about 700,000 b/d. As gas plant NGL raw mix production began to grow in late 2007, throughput rates for pipelines from West Texas to the upper Texas coast increased to full capacity.
Until midstream companies completed the first of the five new NGL raw mix pipelines in 2013, gas processors in eastern New Mexico and West Texas were forced to reject ethane as necessary to cope with pipeline capacity constraints and growth in production of propane, butane, and natural gasoline. Three raw mix pipeline operators completed incremental expansions of existing raw mix pipelines during 2008-09, increasing combined capacity to 790,000 b/d by yearend 2009.
Oneok Field Services completed construction of Overland Pass in December 2008 (OGJ Online, July 1, 2008). Overland Pass Pipeline was the industry’s first new grassroots NGL raw mix pipeline since Seminole Pipeline came onstream in the 1970s.
Overland Pass is the only new raw mix pipeline developed since 2007 that does not deliver NGL raw mix to storage and fractionation in the upper Texas coast, but it increased total takeaway capacity for Rocky Mountains gas plants by about 150,000 b/d, and Oneok Field Services has expanded the capacity by adding additional horsepower and built a lateral to connect gas plants in the Bakken play in North Dakota.
During 2009-13, midstream companies developed six greenfield raw mix pipeline projects and expanded NGL raw mix pipeline capacity (West Texas and South Texas to the upper Texas coast) by about 800,000 b/d. The combined increase in raw mix pipeline capacity for all pipelines (including Overland Pass) that serve gas plants’ core NGL production regions during 2008-14 was 950,000 b/d.
By mid-2014, NGL raw mix pipeline capacity (for gas plants in the Rocky Mountains, New Mexico, and Texas) increased to 1.7 million b/d, and capacity in second-quarter 2014 was more than double available capacity in 2007. During 2008-14 (second-quarter 2008 to second-quarter 2014), NGL raw mix production in the Rocky Mountains, New Mexico, and Texas increased by 755,000 b/d. If all gas plants had operated in full ethane recovery, NGL raw mix production would have increased by 850,000 b/d.
NGL raw mix production in these core regions will continue to increase as long as crude oil production continues to increase at current rates. The important unanswered question: Will midstream companies continue to expand NGL raw mix pipeline capacity for delivery of NGL raw mix to the upper Texas coast during the next 5 years?
Price trends; processing profitability
Petral tracks gas processing economics based on the netback value of NGL raw mix for gas plants in Texas, New Mexico, and the Rocky Mountains. Gas plants in these regions are the primary sources of NGL raw mix deliveries to NGL fractionators in Mont Belvieu.
Based on EIA’s gas plant NGL production statistics, NGL raw mix production for these regions increased by 370,000 b/d during second-quarter 2012 through second-quarter 2014, and production of propane and normal butane increased by about 200,000 b/d. Despite persistent and widespread ethane rejection, ethane production in these regions increased by 106,500 b/d.
Petral estimates ethane rejection by gas plants in these regions in second-quarter 2012 was 48,000 b/d and increased to 157,000 b/d in second-quarter 2014. With full ethane recovery, NGL raw mix production would have increased by 479,000 b/d.
The increase in gas plant production of propane and normal butane occurred during a period of flat demand in domestic markets and resulted in growing supply surpluses. Supply surpluses, in turn, caused spot prices for propane and normal butane to weaken and resulted in the surge in LPG exports from Houston Ship Channel export terminals.
Petral estimates the weight-averaged price of NGL raw mix in Mont Belvieu was 122.7¢/gal ($11.57/MMbtu) in first-quarter 2012. Prices for all NGL components began to decline in second-quarter 2012 and the weight-averaged price fell to a low of 83.9¢/gal ($8.06/MMbtu) in second-quarter 2013.
As projects to expand LPG export capacity on the Houston Ship Channel were completed and the surge in exports began to reduce the accumulated supply surplus, the NGL raw mix price rallied to 95.8¢/gal ($9.20/MMbtu) in fourth-quarter 2013 and 102.7¢/gal ($9.77/MMbtu) in first-quarter 2014.
After 24 months of increasing US LPG exports, LPG freight rates in the international market tripled for LPG shipments from the Middle East to Japan and quadrupled for shipments from the Houston Ship Channel to Japan, according to estimates published by Oil Price Information Service.
The surge in freight rates for spot cargoes was one of the primary reasons for the decline in Petral’s NGL raw mix price index for Mont Belvieu during second-quarter 2014. The NGL raw mix price index declined by 10.8¢/gal and averaged 91.9¢/gal ($8.83/MMbtu) for second-quarter 2014.
Near-term outlook
As long as global benchmark prices for crude oil are $90-100/bbl, crude oil production in the core NGL producing states will continue to increase. Based on current growth rates in crude oil and associated gas production,
Petral forecasts NGL production in the Gulf Coast, Midcontinent, and Rocky Mountains will increase by 300,000-350,000 b/d during third-quarter 2014 through fourth-quarter 2015. Production of propane and normal butane will increase by 175,000-200,000 b/d. US LPG exports will increase by similar volumes to keep US propane and normal butane markets in balance.
So far, international LPG markets have been able to absorb the surge in US LPG exports with limited downward pressure on LPG prices. Specifically, contract prices for propane exports in the Middle East were equal to 62% of Organization of Petroleum Exporting Countries’ (OPEC) Reference Basket for crude prices (ORB) in 2011 and were 65% of ORB in 2013.
Similarly, contract prices in the Middle East for butane contract prices were 74.6% of ORB in 2011 and 76.5% in 2013. North Sea contract prices for propane, however, were 64.3% of ORB in 2011 and fell to 60.4% of ORB in 2013. Similarly, North Sea contract prices were 73.4% of ORB in 2011 and fell to 70.7% of ORB in 2013.
During this period, according to statistics from USA Trade Online, propane exports from the Houston Ship Channel to Northwest Europe were 20,400 b/d in 2011 and increased to 75,000 b/d in fourth-quarter 2013. Similarly, butane exports from the Houston Ship Channel to Northwest Europe were 2,600 b/d in 2011 and increased to 15,700 b/d in fourth-quarter 2013.
As midstream companies complete new terminal capacity along the US Gulf Coast during 2015-16, Petral forecasts butane exports to Northwest Europe (primarily) and other destinations will be double or triple current volumes by yearend 2016. Since propane exports will also continue to increase, downward pressures on global LPG prices will become stronger.
The author
Daniel L. Lippe ([email protected]) is president of Petral Consulting Co., which he founded in 1988. He has expertise in economic analysis of a broad spectrum of petroleum products including crude oil and refined products, natural gas, natural gas liquids, other ethylene feedstocks, and primary petrochemicals.
Lippe began his professional career in 1974 with Diamond Shamrock Chemical Co., moved into professional consulting in 1979, and has served petroleum, midstream, and petrochemical industry clients since. He holds a BS (1974) in chemical engineering from Texas A&M University and an MBA (1981) from Houston Baptist University. He is an active member of the Gas Processors Suppliers Association and serves on GPA’s NGL Market Information Committee.


