New well-productivity data provide US shale potential insights
Rafael Sandrea
IPC Petroleum Consultants Inc.
Tulsa
Ivan Sandrea
Oxford Institute for Energy Studies
Washington, DC
The US has 13 shale plays with major oil and gas resources. Two of them-Bakken and Eagle Ford-account for about 75% of the country's shale oil output. Four plays-Barnett, Fayetteville, Haynesville, and Marcellus-make up 83% of shale gas output, according to the US Enerrgy Information Administration (EIA).
The Marcellus is the premier shale gas play and contains 1.6 times the combined reserves of the other three. It went onstream in 2008 and, according to EIA data, is already the most prolific shale gas producer with an output of 9.28 bcfd in 2013.
The Marcellus is on a robust production growth path and will be the US natural gas production leader for the foreseeable future. EIA projects an equally important role for both the Bakken and Eagle Ford in terms of oil production.
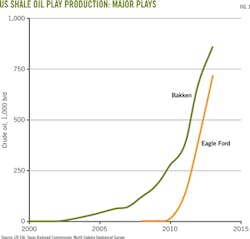
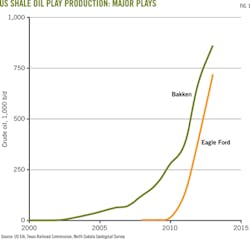
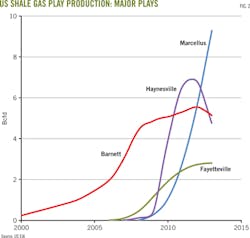
As a result of this shale boom, EIA data show the US is now the world's largest producer of natural gas and has increased crude production to about 8 million b/d from 5 million b/d in 2008 (Figs. 1 and 2).
These are impressive increases yet investors seem to see a different picture. They seem to be tired of waiting for emerging shale plays to become lucrative.
A March 2014 report from the Oxford Institute for Energy Studies states that, over the past 4 years, returns on energy investments have underperformed, sinking as much as 15% from those of the past decade. According to a Rigzone report at the end of 2013, 60,000 shale oil and gas wells have been drilled and the large sums of capital already deployed in shale investments will take 3-4 years before they begin generating positive cash flow.
Shale properties as a whole begin to decline 3-4 years after the initial heavy capital development costs. And massive spending lies ahead because production is maintained by drilling more and more wells to compensate for field decline.
Financial investors want more accurate predictions of key parameters including reserves, true production potential, and a trustworthy lifetime drilling capital expenditures (capex) that have been difficult to get for these shale reservoirs.
Fortunately, we now have substantial field performance data on six major shale plays. By analyzing these data, we can better determine reserves, recovery factors, and production.
At this time only first-order estimates-those assumed during early development of the play-are available. They need to be verified or adjusted. This article develops a methodology for reliably determining well reserves and future drilling requirements based on well-productivity.
Production declines
As shown in Fig. 2, production decline has begun in three of the four major shale gas plays, the exception being the latest start-up-the Marcellus. This is characteristic of early-onset decline in shale plays and occurs a brief 3-5 years from production start-up. In traditional oil fields with similar reserves, that time frame is typically 9-12 years. While such rapid decline is a concern, it also provides an early opportunity to reassess reserves, estimates, and associated recovery factors.
Field-decline analysis has provided fresh estimates of ultimate reserves (EUR) for the Barnett and Fayetteville play-20 tcf and 9 tcf, respectively (OGJ, Aug. 4, 2014, p. 56).
These values are about one-third lower than the latest estimates from EIA's Annual Energy Outlook 2012. The Haynesville began production in 2008 and already peaked at 6.8 bcfd in fourth-quarter 2011. Since then, its output has dropped to 3.87 bcfd at yearend 2013.
Field-decline analysis shows a performance EUR of 12 tcf, a value drastically different from EIA's 2012 estimate of 66 tcf. It should be noted that operators in the Haynesville have also reported a low EUR of 11.4 tcf in their Dec. 31, 2012, disclosures to the US Securities and Exchange Commission (OGJ, Feb. 3, 2013, p. 52). These are surprisingly disappointing numbers for a play that seemed to have much more potential.
The Marcellus kicked off production in 2008 and grew to 10.9 bcfd in December 2013. Its cumulative production is still small, only 6.7 tcf, compared with its estimated technical reserves of 140 tcf reported by EIA.
This short history precludes decline analysis as a tool to reassess the play's performance EUR. Based on the current estimate of its technical reserves (140 tcf), the production potential of the Marcellus would be about 24 bcfd-roughly double its latest yearend output.
Following the reserves reassessments of the three major mature shale gas plays, their revised recovery factors are now 1.7% for the Haynesville, 6.1% for the Barnett, and 11% for the Fayetteville. The overall reserves-weighted average is 5.9%.
A 2013 study by the Bureau of Economic Geology at the University of Texas estimates a 19% recovery factor for the Barnett (OGJ, Aug. 5, 2013, p. 62). The EIA estimates a recovery factor of 7.9% for the Barnett and an overall recovery factor of 13% for all shale gas plays.
What is causing these disparate views of US shale potential?
Undoubtedly, geologic settings of shale plays are exceedingly varied. Which of these many lithologic factors has the most influence on how much oil or gas will be produced-in other words, the recovery factor of the play-is a big unknown.
Unexpectedly, the Haynesville's field performance has centered on pore-pressure gradient. The Haynesville's high pressure gradient-0.75-0.85 psi/ft-is nearly twice the normal pressure gradient of 0.43 psi/ft. The upside of its high pressure gradient has been abnormally high initial production-9.5 MMcfd/well-almost five times that of the benchmark Barnett.
On the downside, however, the Haynesville's wells have very high early decline rates of about 86% a year. The net result is the lowest recovery efficiency-roughly 1.7%-of all major US shale gas plays.
By comparison, the recovery factor of the Barnett is 3.5 times that of the Haynesville. Not surprisingly, the Haynesville is an outlier in the very sturdy power-law relationship between production potential and reserves of the other major shale gas plays.
The recovery factor of the Marcellus would be 9.3% based on EIA estimates of its technical reserves of 140 tcf. That is 58% higher than the average recovery factor for the three mature major gas plays (Table 1).
Well productivity
Peak production in a shale play is an important economic milestone. It signals the onset of decline, which in turn allows the use of decline analysis to estimate more reliably both play and well reserves.
Establishing peak values from field-production data, however, is not always clear-cut. Production rates can plateau or continue growing for a while after the reservoir peaks. This apparent contradiction will be explained later.
A more definitive means of determining peak production uses the ratio of a play's production to the corresponding number of producing wells. For the purposes of this article, the ratio is called "well productivity" and acts as another way of visualizing field production on a per-well basis. (It should not be confused with the same term in reservoir engineering that refers to a specific well parameter defined as the ratio of well rate to pressure drawdown.)
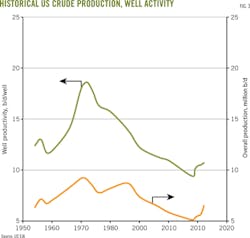
Fig. 3 shows the correspondence between US crude production and well productivity. The trends correlate over the 60 years illustrated in the graph.
It is evident, however, that the well-productivity trendline considerably accentuates the production peak in 1970. To enhance the well-productivity trendline further, it is standard practice to define well productivity as the ratio of yearend (December) values of the field's or play's output and of the number of producing wells.
This gives leading-edge values to the ratio compared with annualized production values that essentially reflect mid-year conditions. The number of active producing wells at yearend includes the number of new completions during the course of the year less retired wells that have reached the end of their productive lives.
It should be emphasized that well productivity is a distinctive field-wide parameter with a decline behavior very different from that of individual wells. For example, the current well productivity for the Haynesville is 1.2 MMcfd/well, which represents the average well production rate of all old and new active wells. New wells in the Haynesville, however, have an average initial production of 9.5 MMcfd (OGJ, Feb. 3, 2014, p. 52).
More importantly for shale plays, well-productivity trends provide a straightforward and reliable estimate of both the number of wells to be drilled in order to sustain production schedules and of the overall well EUR. Well productivity directly accounts for the play's reservoir decline.
Shale gas plays
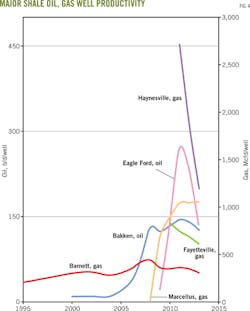
Fig. 4 shows the well-productivity trends for the six shale plays. By looking at the prolific Barnett shale, we see its well-productivity trend grows slowly during early development, reaches a peak of 438 Mcfd/well in 2008, then goes into gentle decline with 303 Mcfd/well in 2013 at a rate of 7%/year.
At the end of 2008, the Barnett had 10,146 producing wells growing to 13,740 by yearend 2009. Subsequently, drilling dropped off considerably with the number of producing wells increasing only by 840 in 2012 and 784 in 2013. Barnett's output slipped.
The low price of gas has not justified the additional 988 wells needed to sustain 5.6 bcfd and compensate for well-productivity and reservoir decline.
A simple equation determines the number of producing wells required to produce 5.6 bcfd with current well productivity of 303 Mcfd/well: (5.6x10⁶) / 303 = 18,482.
With 17,494 actual producing wells at yearend 2013, the deficit of 988 wells would correspond to an additional capex of $3.4 billion, based on average well costs of $3.5 million. For 2014, the number of additional producing wells would need to increase to 1,883 as productivity is expected to decline to 289 Mcfd/well.
The Haynesville, on the other hand, shows a steep well-productivity-decline trend in line with its high early well decline rates of 86%/year (Fig. 4). Well productivity has dropped 64% to 1.2 MMcfd/well in 2013 from 3.3 MMcfd/well in 2010, all of which point towards a low recovery factor.
The Fayetteville's well-productivity decline has been more moderate, dropping 27% to 610 Mcfd/well in 2013 from 833 Mcfd/well in 2010. The steeper the well-productivity decline, the more capital investment in new wells is required to compensate for reservoir decline and maintain production levels.
Based on the Haynesville's well productivity of 1,195 Mcfd/well in 2013, the capex required to maintain an output of 6 bcfd, instead of its actual output of 4.76 bcfd, would have amounted to $17 billion for 1,783 additional wells.
The well-productivity trendline of the Marcellus shows a normal start-up growth pattern that has leveled off to around 1 MMcfd/well (Fig. 4). Development took off at a blistering pace, with 4,127 producing wells in 2011 from only 763 in 2009.
In 2012, the number of producing wells had grown to 8,982, and to 10,369 by 2013. Output reached 11 bcfd in December of 2013, less than half of its expected production potential of 24 bcfd. The cost of a well runs about $6 million.
One of the advantages of using well productivity to define reservoir peak is that it is a more sensitive measure than field-production rates. Fig. 4 shows the Barnett's well-productivity peak was in 2008, whereas Fig. 2 shows its production peak occurred in 2012.
Particularly for shale plays, the well-productivity parameter has a huge advantage: It provides a quick, reliable, ongoing field estimate of the number of new wells required to maintain a desired level of production.
Current methodology assumes an outlook of drilling requirements based on a type-well-production profile. This does not take into consideration, however, the notorious variations in well-production rates within shale plays. It also fails to account for play and reservoir decline.
These shortcomings can lead to gross underestimates of critical capex requirements and overestimates of future production rates.
Additionally, well-productivity trends generally follow the standard exponential-decline model, which provides a simple determination of the average well EUR over the entire play and of future declining well-productivity values.
Table 1 gives the per-year well-productivity exponential-decline rates for each of the three mature shale gas plays: Barnett 7%, Fayetteville 10%, and Haynesville 35%.
By 2020, well productivity in the Barnett would drop to 190 Mcfd/well from its current level of 303 Mcfd/well. Fayetteville's would drop to 306 Mcfd/well from 610 Mcfd/well. And, Haynesville's well-productivity would drop drastically to 102 Mcfd/well from its present value of 1,195 Mcfd/well-a product of its high decline rate.
Average well EUR based on well-productivity decline is 2.2 bcf/well for the Barnett, which is 69% higher than the previous EIA estimate of 1.3 bcf/well. For the Fayetteville it is 3.0 bcf/well, compared with the previous estimate of 1.3 bcf/well. Haynesville comes in at 3.5 bcf/well vs. the previous estimate of 2.7 bcf/well.
Note that all of these performance well EUR values are higher than those obtained with type-well analysis. Nonetheless, we should remember that calculated well EURs will be greatly affected by the productive life of the wells.
The Barnett is the best documented of the plays in this respect, and statistics indicate a low-average-well productive life of 7.5 years. This is partially due to well-decline rates and to complex completion methods employed in shale plays.
Table 1 provides a summary of the values discussed above.
Shale oil plays
Fig. 4 shows the well-productivity decline trends for the two major shale oil plays, Bakken and Eagle Ford. It illustrates that the Bakken hit a peak of 144 b/d/well in 2011. Nonetheless, its output has grown continuously from 274,000 b/d in 2010 to 836,000 b/d in 2013 (Fig. 1).
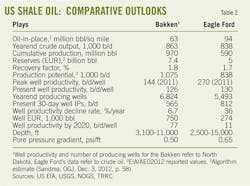
Drilling was stepped up considerably. There were 2,064 producing wells in 2010, 3,275 in 2011, 5,048 in 2012, and 6,824 in 2013. Present 30-day initial production of new wells in the top-four producing counties covering this shale deposit averages 735 b/d/well. The overall average across the entire play is 565 b/d/well (Table 2).
The current level of drilling activity is enough to compensate for the Bakken's relatively soft well-productivity decline rate of 6.7%/ year. It also provides output growth.
By 2020, well productivity in the Bakken would have declined to 77 b/d/well. Sustaining an output similar to its latest yearend level of 863,000 b/d would require 11,208 producing wells-nearly double the present number.
In regard to the Eagle Ford, Fig. 1 shows a vigorous, exponential growth of its crude oil production to 717,000 b/d in 2013 from barely 15,000 b/d in 2010. Meanwhile, its well productivity shows a continuous decline from a high of 270 b/d/well in 2011 to a current level of 130 b/d/well (Fig. 4).
Crude oil production, however, has increased because of intense drilling activity. There were 480 producing wells in 2011, 1,742 in 2012, and 5,493 in 2013. Oil prices favor the economics of drilling more and more in-fill wells. For these wells, the 30-day well initial production is 812 b/d-44% more than that of the Bakken.
Eagle Ford wells cost on average $4-6.5 million compared with $5.5-8.5 million for its counterpart. But because of the high decline rate of Eagle Ford's well productivity-36%/year-an astronomical number of producing wells, roughly 73,000, would be needed to sustain an output level of 800,000 b/d.
There are many interesting comparisons in the development of these two shale plays. The well density in the sweet spots of both is now approaching 40-acre levels (16 wells/sq mile). There are now 6,824 producing wells in the Bakken and 5,493 producing wells in Eagle Ford, which started production a couple of years later.
Essentially, we have been drilling to outpace the decline. Present yearend well-productivity levels in both are similar: 126 b/d/well for the Bakken and 130 b/d/well for the Eagle Ford. By 2020, however, the Bakken's well productivity would drop to 77 b/d/well and the Eagle Ford's to 11 b/d/well, based on their respective decline rates of 6.7%/year and 36%/year, respectively.
Performance-well EURs calculated for the Bakken and Eagle Ford are 750,000 bbl/well and 274,000 bbl/well, respectively. The previous EIA-estimated values under type-well analysis are 550,000 bbl/well for the Bakken and 280,000 bbl/well for Eagle Ford.
For both the Bakken and Eagle Ford, insufficient production history precludes the use of field-decline analysis to verify their reserves.
The Bakken had produced less than 1 billion bbl of crude oil at the end of 2013, while Eagle Ford's cumulative crude oil production was less than half, only 0.43 billion bbl (OGJ, Jan. 6, 2014, p. 48). The technical reserves listed in Table 2 for both plays are those reported by EIA and the US Geological Survey (USGS).
The reserves for the Bakken (7.4 billion bbl) include those of the contiguous Sanish and Three Forks formations, according to the latest USGS assessment in April 2013 (Reference No. 8). This level of reserves would imply a production potential of 1.75 million b/d based on field developed power-law algorithms relating production potential and reserves. The Bakken's first-quarter 2014 crude oil output, as reported by the North Dakota Geological Survey (NDGS), was 892,000 b/d and growing.
The Eagle Ford's technical reserves remain at 3.3 billion bbl, according to EIA's 2012 report. This would imply a production potential of 606,000 b/d. Its crude oil output, however, already reached 838,000 b/d in first-quarter 2014, as reported by the Texas Railroad Commission (TRRC).
The TRRC also reported that the output for 2014 is expected to be 803,000 b/d, which would imply a slight drop off from its first-quarter 2014 level. If we assume an apparent peak of 838,000 b/d, the corresponding reserves of Eagle Ford would be about 5 billion bbl of crude oil.
Table 2 lists these tentative figures. Both the Bakken and Eagle Ford's reserves will remain unverified, pending additional production history for an appropriate performance-decline analysis. Logistic-decline analysis is the ultimate determinant of a field's reserves.
Shale gas, oil definitions
Permeability: Shale gas plays are ultratight source rocks with permeabilities of 1-100 nanodarcies. Tight gas sands have permeabilities of 1-100 microdarcies.
Shale oil plays, such as the Bakken and Eagle Ford, are defined in this article as very tight reservoirs with permeabilities of 1-10 microdarcies.
Oil plays such as the Permian and Austin Chalk have permeabilities from 10 microdarcies to 1 md and are termed tight oil plays.
Conventional oil and gas fields have permeabilities of 1-100 md. Unconsolidated oil sands, such as the Canadian and Orinoco, have permeabilities of 0.5-15 darcies.
Porosity: Shale gas plays have log porosities varying 3-10% and shale oil plays 5-10%. Tight gas sands have porosities varying 3-12% compared with variations of 11-12% for tight oil sands. Porosities in conventional oil and gas reservoirs are 10-15% and up to 35% for unconsolidated sands.
Bibliography
Cook, Troy A, "Procedure for Calculating Estimated Ultimate Recovery of Bakken and Three Forks Formations Horizontal Wells in the Williston Basin," USGS Open File Report 2013-1109.
Sandrea, Ivan, "US Shale Gas and Tight-Oil Industry Performance - Challenges and Opportunities," Oxford Institute for Energy Studies, March 2014.
Warlick, Don, "Three Tiers of US Shale Plays," Oil & Gas Financial Journal, August 2013, pp. 24-27.
"Shale Technology Review," World Oil, March 2014.
The authors
Rafael Sandrea ([email protected]) is president of IPC Petroleum Consultants Inc., Tulsa. He was formerly president and chief executive of ITS, a Caracas-based petroleum engineering firm he founded and directed for 30 years. He holds a PhD in petroleum engineering from Penn State University.
Ivan Sandrea is CEO of Sierra Oil and Gas, an independent oil and gas company in Mexico City. He is an active member of the Oxford Institute for Energy Studies and Energy Policy Research (EPRINC) in Washington, DC. Sandrea holds a BS in geology from Baylor University, an MS and MBA degrees from Edinburgh University.
