Eurasian pipelines threaten LNG growth
Barry Aling
Gaffney, Cline & Associates
London
Early LNG suppliers to the East Asian market, such as Malaysia and Indonesia, may be able to retain their market positions based on existing long-term contracts, but newer projects in Australia, Papua New Guinea, Persian Gulf states, and Mozambique could find themselves at commercial disadvantage if overland Eurasian infrastructure expansion proceeds, with fundamental consequences for the oil and gas industry's plans for hydrocarbon exploration in deep water and other frontier areas.
While Western Europe must address its undue natural gas dependence on a potentially hostile Russia, massive increases in LNG exports from North America, Australia, and the gulf states over the next 10 years will double supply capacity and create serious competition for Russia and its Caspian region neighbors in international gas markets.
At the same time, massive growth in gas demand, led by China and its East Asian neighbors, provides Eurasian exporters with the opportunity to aggressively exploit their huge reserves and diversify their own dependence on Western European gas markets. The Western perspective of illegal Russian action in Crimea and complicity in a downed passenger jet has led to trade-impeding sanctions. But an economic imperative of securing energy for their high-growth economies dominates the East Asian view.
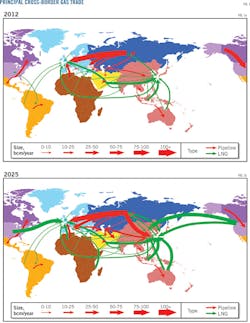
Fig. 1 shows gas trade patterns in 2012 and projected for 2025 undergoing fundamental change, and as new reserves and demand sources multiply, more fluid and competitive international pricing for gas will emerge. The advent of major new frontier discoveries and rapid growth in shale gas and other unconventional sources promises to transform the global energy market, with the International Energy Agency (IEA) estimating that global gas reserves may exceed 250 years of current global demand.1
Even allowing for sharply rising Asian demand, this scale of supply growth presages increased competition among gas exporters, potentially narrowing international price differentials to $10-12/MMcf and exposing LNG contracts to downward pricing pressure. Central to the longer-term outlook will be China's ability to tap into this incremental production and substitute gas for coal in power generation. The recent 30-year Sino-Russian agreement (OGJ Online, May 21, 2014) for Russia to supply 3.7 bcfd at a reported price of ~$10/Mcf is unlikely to be the last, as Eurasian exporters attempt to carve a strategic advantage as lower cost suppliers.
Key metrics
Global gas production of 3.37 trillion cu m (tcm) in 20132 was only 70% of the equivalent oil output and as little as 35% when expressed in value terms. International trade in gas of 18.7 million boe/d was only one-third of oil trade volumes. But a number of key factors will transform gas markets over the next 15 years:
• The US Energy Information Administration (EIA) estimates US proved gas reserves at end-2011 of 9.9 tcm, with additional undeveloped shale-sourced reserves of 21 tcm.3
• US LNG export approvals to date, totaling more than 200 billion cu m (bcm)/year,4 will propel the country to global leadership in LNG exports by 2025. Additional export applications are in process that could double this figure.
• Non-US LNG capacity additions through 2025 will add 300 bcm/year,5 with Australia, Canada, and Russia accounting for roughly 80% of the increase.
• Current US gas prices of $3.75/MMbtu are less than half of UK wholesale prices and less than one-third Japanese prices.
• Russian and Turkmen proved reserves of roughly 65 tcm2 3 are sufficient to double existing production and meet demand growth from both eastern and western markets, potentially equalizing gas prices between Asia and Europe.
• Iran accounts for nearly 20% of global gas reserves with only 5% of production and negligible exports. Post-sanctions rehabilitation of the Iranian economy will include expansion of the planned pipelines to both southern Europe and India.
• Major new discoveries in Mozambique, the eastern Mediterranean, Azerbaijan, Papua New Guinea, and Venezuela will intensify supply competition.
Supply scenarios
BP PLC's 1981 annual review estimated global reserves at only 82 tcm, but by 2013 this figure had more than doubled to 186 tcm, while the EIA estimates that global recoverable reserves from shale gas alone could add a further 220 tcm.6 The authors believe frontier reserves from the Arctic and deep offshore can move potential reserves towards 1,000 tcm.
Even allowing for rapid demand growth in global gas consumption from the present 3.3 tcm/year, gas reserves of this scale can probably meet global demand for up to 250 years. The key constraint to growth in gas production is transportation, given the long lead times and large capital costs of both intercontinental pipelines and export-scale liquefaction plants, but plans already in place will add significant capacity.
Pipeline gas trade
International deliveries of gas by pipeline totaled 711 bcm in 2013, with exports from the Russian-Caspian region accounting for 40% (BP), Netherlands-Norway 22%, and North America 17%.2 Near-term export capacity additions in Europe are limited to offshore frontier reserves in Norway, pending wider exploitation of both shale gas in countries such as Poland and the deepwater discoveries in the eastern Mediterranean, while saturated demand in the US and Canada will limit further growth in cross-border North American pipeline trade.
The IEA, by contrast, projects new pipeline capacity from Russia and the Caspian region of roughly 240 bcm, heading both eastward and westward, by 2020. The build-out will double Eurasian gas exports to at least 500 bcm/year, giving the region's producers a commanding 50% share of its projected 1,000-bcm/year 2020 market for pipeline gas.
With proved Eurasian reserves of about 70 tcm and potential reserves of similar scale,7 ample scope exists for even greater expansion of pipeline deliveries, possibly to as much as 1,000 bcm/year. Even without the addition of Iranian and Azerbaijani exports to Turkey, southern Europe, and India, therefore, the potential exists for international trade in pipeline-delivered gas to more than double to 1,500 bcm/year by 2030, with Eurasian shipments taking a 65% share.
LNG trade
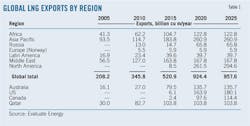
LNG trade volumes totaling 325 bcm in 2013 made up a 31% share of global gas trade, but new liquefaction will nearly treble LNG capacity by 2025 to an estimated 958 bcm/year (see accompanying table).5 While Qatar dominates LNG trade with a 32% share of the global market, capacity additions in the US, Australia, and Canada alone could add 400 bcm/year by 2025.

Key differences, however, exist in terms of pricing these incremental supplies because part of Australian LNG will be sourced from relatively expensive deepwater fields, while North American plants will be fed by lower cost shale-sourced reserves. While this differential in pricing power may have limited effect in the short term, due to the long-term nature of LNG contracts, the prospect of excess supply from competing pipeline and LNG exporters may have large implications for relatively expensive supplies from Australian and elsewhere by the 2020s, particularly until its own shale reserves are commercialized.
Doubling the combined pipeline and LNG export capacity to 2,000 bcm/year by 2025 would raise the share of traded gas to roughly 50% of IEA's forecast 2025 global production of roughly 4,000 bcm/year. Incremental supply on this scale raises obvious questions concerning future gas prices, and with Russia, the US, Australia, and Canada accounting for nearly 60% of this supply, the scope for gas to become a primary source of geopolitical competition is very high.
Demand scenario
Natural gas will become an increasingly important fuel source as its use in power generation and transportation grows. The speed with which this transition occurs, however, will hinge on three key factors:
• The rate at which coal-fired power generation is superseded by natural gas, particularly in important industrializing economies such as China and India.
• Access to long-term contracted supplies of gas at prices that are competitive with alternate fuels.
• The rate at which natural gas can displace oil-based transport fuel, particularly diesel, either directly or through natural gas-based substitutes.
While the use of coal as the dominant fuel source for power generation in the Organization for Economic Cooperation and Development (OECD) economies has waned in recent years due to mandated targets for lower greenhouse gas emissions (GHGs), a reverse trend in major developing economies, including China and India, means coal continues to supply more than 40% of global electricity demand.8
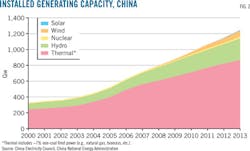
Fig. 2 shows the extent to which the growth in Chinese generating capacity has depended on coal.
China's role
China's rapid economic expansion has required it to build one new coal-fired power plant a week. With installed capacity having doubled in just 7 years to 1,250 Gw (Fig. 2), China now leads the world in electricity production and accounts for 50% of global coal consumption.2 8 Pollution concerns, however, have prompted an urgent reappraisal of the country's energy policy, with natural gas, which produces less than half the equivalent GHGs, emerging as a medium-term alternative.
IEA-forecast growth in Chinese gas demand suggests major changes to China's energy mix are unlikely in the near term, presumably due to investment requirements and lead times associated with changing the country's power generation policies. IEA expects 8-bcm/year growth in Chinese gas consumption over the next 6 years to 216 bcm/year by 2020. This forecast, however, may prove conservative, given China's demonstrated ability to rapidly transform its economy.
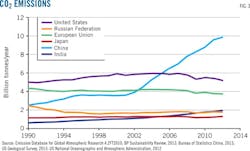
Electricity demand in China rose by 2% in 2013 to 5,320 Tw-hr, more than 20% of the global total. With 70% of the fuel requirements for generating this electricity met by coal, the country's 10 billion tonnes of CO2 emissions represent 29% of the world total (Fig. 3).
The 94 Gw of generating capacity commissioned by China in 2013 would increase coal consumption by roughly 230 million tonnes and generate an additional 175 million tonnes of GHGs, or 47% of global GHG additions in that year (based on 51% utilization).9 Meeting the equivalent capacity expansions through natural gas would cut incremental emissions nearly in half to about 96 million tonnes and increase gas demand by roughly 95 bcm/year.
In addition to power generation, rising urban living standards in China will lead to new domestic space and water-heating markets for gas. According to China's 12th 5-Year plan to 2015, only 250 million Chinese, or 18% of the population, will have access to natural gas, compared with 85% in the UK.
Supply-demand balance
The longer-term demand picture in Asia suggests that a market for new natural gas supplies will develop over time, but data for important consuming countries such as China and India suggest that their infrastructural capacity to absorb volumes of the amount forecast will not emerge until the latter half of the 2020s, creating a potential 2017-25 supply overhang. IEA forecasts non-OECD gas demand to account for 80% of global gas demand growth 2015-25, but this will add only 497 bcm/year to global consumption by the end of the 10-year period.
Looming supply competition in the low-growth European market, which at present accounts for around 45% of global gas trade, will steer supply growth towards Asia. China is likely to overtake Japan and Germany to become the largest net importer of gas by 2020 and, together with neighboring Asian countries, become the focal point for trade in both piped gas and LNG in the 21st Century. But while LNG will feature prominently in this shift, more profound changes to the large-volume export trade could emerge if Russia and the Caspian states embark on an eastward pipeline network corresponding to their reserve capacity.
The Ukrainian crisis may in fact intensify the potential for a gas-supply overhang as Russia moves more aggressively to diversify its markets. Russia recognizes that Asian demand offers a major growth opportunity compared with the relatively low-growth European market in which US LNG imports will be competitive. Russia, Turkmenistan, and Iran, with combined proved reserves equal to more than 25 years of total global demand, have the resources and geographical position to carve out dominant positions in the East Asian market via overland delivery at prices that could prove compelling for China and India.
East Asian consuming nations are also more likely to adopt a neutral stance in any disputes between Russia and the West as China's Mar. 15, 2014, abstention in the UN Security Council Crimean vote demonstrated. Similarly, the Ukrainian dispute may hasten European efforts to regularize relations with Iran to promote more diversified gas supply in the longer term, with Italy and Germany particularly vulnerable in the short term to any disruption in Russian supplies.
The factors affecting the international market for natural gas over the next 15-20 years are numerous. But the probability of oversupply appears to outweigh the prospect of shortages, and in such a scenario a narrowing of existing wide price differentials is very likely.
The price for LNG landed at Asian terminals averages $14-16/MMcf with most contracts benchmarked to thermally adjusted oil-equivalent prices. With North American gas prices at $3.50-4.50/MMcf and allowing $4-6/MMcf of liquefaction and transport costs, the scope for North American LNG to displace existing LNG supplies is material and may drag Asian LNG prices towards $10-12/MMcf as old contracts are replaced.
References
1. International Energy Agency special report, "Golden Age of Gas," World Energy Outlook 2011.
2. BP Statistical Review of World Energy, June 2014
3. US Energy Information Administration, "Review of Emerging Resources: US Shale Gas and Shale Oil Plays," Intek Inc., July 2011.
4. US Department of Energy, "Applications Received by DOE/FE to Export Domestically Produced LNG from the Lower 48 States," as of Jan. 22, 2014.
5. Evaluate Energy database, as of January 2014.
6. "World Shale Gas and Oil Resource Assessment," EIA/ARI, June 2013
7. US EIA, International Energy Statistics 2014.
8. US EIA, International Energy Outlook 2013.
9. UK Government, British Embassy Beijing Report, January 2014.
The author
Barry Aling ([email protected]) is a director of City of London Investment Group PLC. He is a former director of Gaffney, Cline & Associates and continues to write for GCA on a number of topics including the geopolitics of energy. Aling has also held senior executive positions with Indosuez WI Carr Securities Ltd., Swiss Bank Corp., and most recently UK-based Asset Management Investment Co. PLC. He earned a BS (2014) in International Studies from the Open University, Milton Keynes, UK.