Rising output, slow demand to boost US product exports
John R. Auers
John M. Mayes
Turner, Mason & Co.
Dallas
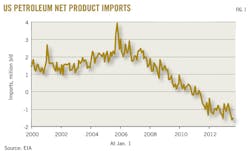
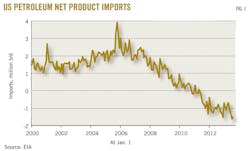
In 2005, the US was the world's largest importer of petroleum products, with net volumes averaging almost 2.5 million b/d, according to the US Energy Information Administration (EIA). Turner, Mason & Co., Dallas, now estimates that a combination of increasing production rates and a decline in domestic consumer product demand will push the US to become the world's largest net product exporter by 2023.
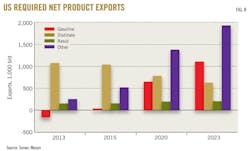
This reversal will present immense challenges to US refiners in developing new foreign markets and to foreign refiners, which will face greater competition from US products. If domestic refining rates are maintained, about 13% of US gasoline (1.1 million b/d) will need to be exported in 2023 along with 10% of distillate production and 66% of resid output.
This continues to be a dynamic and evolving situation, driven by the substantial growth in US crude production and changes in domestic demand patterns, affected largely by state and federal governmental policies.
Recent trends
Historically, the US has been a net importer of both crude oil and petroleum products. The dependency on foreign product imports peaked in 2005 (Fig. 1) and has steadily decreased since. By 2011, the US had become a net exporter of petroleum products for the first time in several decades. This trend has continued, according to the latest data from EIA, and in 2013 net exports were to exceed 1.3 million b/d.
Middle distillates (diesel and jet fuel), EIA also concludes, comprised more than 80% of US product exports in 2013. Most other products were also surplus, with net exports of residual fuels, pentanes-plus from gas fields, and LPGs all more than 100,000 b/d.
Gasoline (including blendstocks) was the largest net product import at about 150,000 b/d in 2013, said EIA, down from more than 1 million b/d as recently as 2007. Over the next 2 years, we expect the US to become a net exporter of gasoline as well.
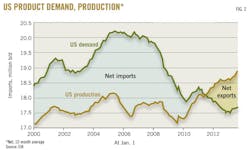
The steep reversal in product supply balances has come from a combination of declining US product demand as well as increased production (Fig. 2). EIA data show that, since 2005, demand for petroleum products in the US (C3s and heavier) has fallen by 2.5 million b/d, while product yields have increased by more than 1.1 million b/d.
The drop in demand was driven largely by reduced economic growth caused by the 2008-09 recession. But it also has been influenced by increasing corporate average fuel economy (CAFE) requirements as well as a reduction in vehicle miles traveled (VMT) by consumers.
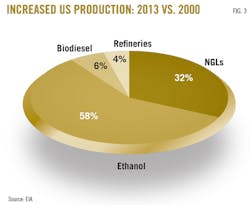
Product yields and volumes also have changed in recent years, with increases coming almost exclusively from outside the refinery gate. Since 2000, production of intermediate and finished products has increased by nearly 1.3 million b/d (Fig. 3).
The largest component of this gain (58%) has resulted from addition of ethanol into the gasoline pool. Another 32% of the increase results from the growth of C5+ as well as C3s and C4s associated with the rise in natural gas field production driven by the US shale boom. Biodiesel has contributed 6% of the increase, leaving incremental refinery output to provide the remaining 4%.
Even this small increase in refinery production can be considered a major development, given the substantial drop in domestic product demand, which in the past has led to reductions in both refining capacity and utilization.
Here, too, the shale boom has had an immense influence, as growing domestic crude and natural gas production has led to lower feedstock and operating costs for US refiners. This has increased their competitiveness and facilitated the export of products to other markets.
US product demand forecasts
Turner, Mason believes that many of the product demand trends established in the last 10 years are likely to continue through the next decade. Further declines in US product demand can be expected, but assuming a return to more historic economic growth rates (gross domestic product growth of 2-3%/year), these declines will not be as steep as experienced over the last 5 years. By 2023, Turner, Mason forecasts, total demand for petroleum products in the US will decline by 700,000 b/d compared with 2013 levels.
The greatest demand decline will be seen in gasoline. The current CAFE program (2012-16) will improve fuel economy by more than 31% for automobiles and 14% for light trucks. Turner, Mason also has incorporated the next round of requirements (2017-21) into its forecasts, which will increase automobile standards by another 30% and light trucks by nearly 27%.
The CAFE programs will not only decrease total transportation fuel demand but also induce a modest transition to diesel vehicles ("dieselization") that will shift an estimated 160,000 b/d in demand from gasoline to diesel by 2023.
The combined effects of these initiatives will force a drop in gasoline demand to an estimated 7.5 million b/d by 2023 from 8.7 million b/d in 2013, a decline of more than 14%. Additional demand declines could be expected after 2023 as a result of continued turnover of the fleet to higher mpg vehicles and could be particularly steep if even more stringent CAFE requirements proposed for 2022-25 are enacted.
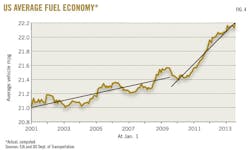
The early effects of the CAFE program already are being felt (Fig. 4). The real, measured fuel efficiency of the US automobile fleet has improved by more than 1 mpg since 2001, as calculated by Turner, Mason using data from EIA and the US Department of Transportation (DOT). About 40% of this gain was achieved through small increases in light truck requirements and shifts to smaller vehicles.
Most of the improvements have come since 2011, when mileage levels jumped to nearly 22.2 mpg by mid-2013 from slightly more than 21.4 mpg as CAFE requirements have begun to ramp up more rapidly. Fig. 4 shows the actual computed average fuel economy increases in the US over the last 12 years.
Despite the improving fuel economy, which reduces costs and provides some incentive for more driving, the number of VMTs has stagnated in recent years. VMT increases of 2-4%/year were the norm in the 1980s and 1990s, when fuel prices were low. But beginning in 2000, driving patterns changed due to higher fuel prices and a variety of demographic shifts.
From 2000 to 2007, changes in VMT declined to only a 0.5%/year increase. The recession (and price spike) year of 2008 saw a plunge of 1.8% followed by another drop of nearly 0.7% in 2009, according to DOT data. From 2010 through most of 2013, VMT essentially has been unchanged. These results come despite US population increases of nearly 1%/year.
The decline in petroleum gasoline demand has been even steeper than the decreases in total demand as a result of rapidly increasing mandates for ethanol blending. In 2013, EIA data show the ethanol portion of the gasoline pool, representing slightly less than 10% of total gasoline, grew to nearly 850,000 b/d from nominal levels before 2003.
As a result of the US Environmental Protection Agency's (EPA) recent announcement of the 2014 blending requirements (OGJ Online, Nov. 15, 2013), Turner, Mason has assumed that the mandate will remain at 10% over the next decade. We have also assumed no substantive breakthroughs in cellulosic technology will be made and Renewable Fuels Standard (RFS) advanced biofuel targets will be continually reduced to reflect this reality.
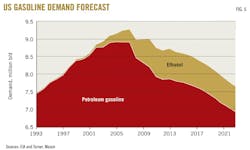
Primarily because of the increases in CAFE requirements, gasoline demand will continue to decline through the decade (Fig. 5). This drop will occur despite an assumed bump in VMT, which we believe is possible as a result of the declining cost of driving (high fuel efficiency and low prices driven by shale production increases). Turner, Mason has assumed a long-term VMT growth rate of 1.15%/year, which is lower than in the pre-2000 period but higher than the last 10 years.
Given all these assumptions, we expect petroleum-derived gasoline demand to fall to less than 7 million b/d by 2022, its lowest level since 1985 (Fig. 5).
As demand for gasoline falls, demand for middle distillates will continue to rise. Spurred by steady but modest economic growth, distillate demand will increase by nearly 600,000 b/d over the next decade. Some government policies will depress distillate demand, while others will stimulate growth.
The Heavy-Duty National Program (HDNP, the diesel equivalent of CAFE) will improve diesel engine efficiencies by about 10-15% by 2017, which will reduce demand growth over the following decade by 200,000 b/d. Turner, Mason estimates the combination of the dieselization of the automobile fleet and the shift to low-sulfur bunker fuel, however, will add an additional 280,000 b/d of distillate demand.
Global bunker sulfur levels are mandated by the International Maritime Organization (IMO) to fall to 0.5% in 2020 while sulfur levels in most coastal waters surrounding the US will drop to 0.1% in 2015. Much of this transition will be accomplished by a shift to distillate-based bunker fuels and away from resid.
Demand for residual fuels will decline by more than 60% in the next decade from 2013 levels, Turner, Mason estimates. Resid demand has been falling in the US and the rest of the world for more than 20 years; this will continue because of the push towards use of lighter and cleaner fuels. Demand will drop to slightly more than 100,000 b/d in the next 10 years from levels of about 300,000 b/d in 2013. A large part of this decline (120,000 b/d) will be prompted by the policy-driven shift to low-sulfur bunkers previously discussed.
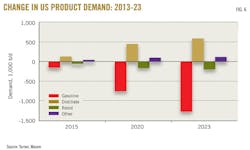
The demand for all other petroleum products will rise modestly in the coming decade, by about 120,000 b/d/year, or 0.3%/year, on average. Fig. 6 shows Turner, Mason's projections for US product demand, which, as discussed, decreases by about 700,000 b/d in total from 2013 to 2023.
US production forecasts
Turner, Mason has estimated that, while demand for finished products will decline in the next 10 years, production will increase by 1.85 million b/d. The bulk of this gain (more than 80%) will be from the field production of NGLs.
Prompted by a wide spread between crude oil and natural gas prices, natural gas drilling will continue to be heavily oriented towards production of liquids. As a result, Turner, Mason expects production of NGLs (C3+) to jump by more than 1.5 million b/d in the next decade with most of the output being C3 and C4.
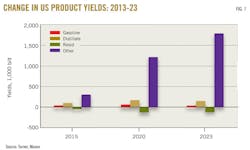
The production of gasoline will remain flat over the next 10 years (Fig. 7) as conflicting trends struggle to push yields in opposite directions. The transition to lighter shale crudes with very high naphtha contents will tend to produce more gasoline (about 200,000 b/d by 2023) despite stronger distillate demand encouraging refiners to "reshape" their yield patterns towards more distillates by investing in hydrocracking capacity. Combined with a decrease in the volume of blended ethanol, this investment will roughly counter the yield increases, by our estimates.
Turner, Mason has identified 65,000 b/d of announced hydrocracking additions in the US, with expectations of an additional 85,000 b/d in new capacity yet to be announced. The gas oil processed in these units will reduce fluid catalytic cracking (FCC) rates and shift gasoline output into distillates. Hydrocracker additions beyond these levels would cause gasoline production to decline.
Distillate production will rise by nearly 160,000 b/d by 2023, Turner, Mason estimates. This will be due to higher refining charge rates and incremental hydrocracker processing compared with FCC processing.
Biodiesel blending levels are held constant, consistent with the recent EPA announcement regarding RFS standards, which held 2014-15 biodiesel requirements level with 2013.
Mirroring the downward trend in demand, resid production will fall by 130,000 b/d during the next 10 years. Resid yields in noncoking refineries will decline as refineries shift to the lighter crude slates brought on alongside increased shale production.
In addition to NGL growth discussed earlier, the yield of other (mostly light) products also will increase by nearly 250,000 b/d as the lighter shale crudes spur higher C3, C4, and light naphtha production at traditional refineries and as similar products come from new condensate splitters.
Because of the sharp growth of Eagle Ford crude and condensate production, Turner, Mason has estimated slightly more than 1 million b/d of these crude grades will be processed through splitters to remove surplus light ends and yield crude grades more suitable as refinery feedstocks. By our estimates, these splitters will yield nearly 150,000 b/d of C3 to C6 output.
Net product balance
Combining the increased petroleum product production of 1.85 million b/d with domestic demand decreases of 700,000 b/d creates a growth in US product surpluses of more than 2.55 million b/d over the next decade. Given US current exports of 1.3 million b/d, this results in a net product surplus of nearly 3.9 million b/d by 2023 (Fig. 8). This represents nearly 19% of US production compared with a level of 7% in 2013.
If these volumes of product exports cannot find markets, refinery run rates in the US will decline to levels that cannot be sustained.
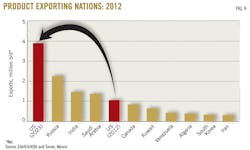
While the US was the world's largest petroleum product importer as recently as 2005, the surge in production and decrease in demand have reversed this balance. Turner, Mason estimates that the US was the world's fourth largest product exporter in 2012 (Fig. 9) and will likely become the global leader in 2023 if refinery processing rates can be maintained.
Latin America has become the principal destination for US products. Currently, EIA shows the US supplies about 19% of total Latin American demand, and this market takes more than 50% of total US product exports. We expect that more growth is possible as Latin American demand growth exceeds planned regional refinery additions.
But to enable product exports of 3.9 million b/d by 2023, many new product markets will have to be developed. Exports of diesel to Europe and both gasoline and diesel to West Africa have been growing over the last few years. Additional growth is possible in these markets as less-competitive European refineries are shuttered and product demand growth in Africa accelerates.
But it is Asia—where the majority of worldwide product demand growth is to take place—that will have to be the destination for a large portion of incremental US production if this level of exports is to be sustained.
The improving competitive position of US refineries that has resulted from decreased feedstock and fuel costs stemming from increased shale production will go a long way toward facilitating this "export model" for the industry. These improvements in cost structure have combined with existing advantages—such as more complex and capable facilities, an extensive logistics and support infrastructure, and a highly skilled and flexible work force—to mold domestic refining into perhaps the most competitive in the world.
There are, however, threats to the model.
These include protectionist tendencies by the US to restrict product exports and by foreign countries to penalize or restrict imports. Importing countries also will make an effort to reduce dependency by building new refineries, increasing alternative fuel mandates, and possibly establishing efficiency standards of their own. New export refineries in the Middle East and other locations, many of which have some of the same advantages as US plants, will also compete for market share.
Perhaps the biggest threat will be policies by the US government that either suppress domestic demand for petroleum products, which would push the levels of exports needed to maintain the export model even higher, or add costs to US refining operations.
The authors
John R. Auers ([email protected]) is an executive vice-president with Turner, Mason & Co., Dallas. He is the team leader of The Outlook, a biennial report that forecasts supply, demand, and pricing for crude oils and petroleum products worldwide. He also leads assignments in refining economics and planning, LP modeling, downstream asset valuation, crude oil valuation and capital investment and strategic planning. Auers joined the firm in 1987 after 7 years with Exxon Corp., with which he held various positions at its Baytown, Tex., refinery. He holds a BS (1980) in chemical engineering from the University of Nebraska and an MBA (1984) from the University of Houston-Clear Lake. Auers is a licensed professional engineer in Texas and Nebraska and is a member of TSPE and AIChE.
John M. Mayes ([email protected]) is director of industry analysis and special studies at Turner, Mason & Co. and a major contributor to its Outlook publications and contributes to the company's analyses of global refining. He contributes in refining economics and planning, downstream asset valuation, crude oil valuation, and capital investment and strategic planning. He holds a BS in chemical engineering from Texas A&M University and was employed in various refining, supply, and marketing positions with Fina, Ultramar, and BP before joining Turner, Mason in 2006.
