Case study: Production benefits from increasing C-values
Hamed Mansoori
National Iranian Oil Co.
Shiraz, Iran
Feridun Esmaeilzadeh
Shiraz University
Shiraz, Iran
Dariush Mowla
Shiraz University
Shiraz, Iran
A. Hassan Mohammadi
South Zagros Oil & Gas Production Co.
Shiraz, Iran
A case study performed in a southern Iran oil field indicates that the C-value used in API RP 14E can be safely increased, enabling increased production from fewer wells and decreasing drilling costs.
Erosion refers to material wear caused by a gas or liquid; it may also include abrasion from entrained particles. Erosional causes are complex; slight changes in operational conditions, such as fluid velocity, affect erosion behavior. Mechanisms that can cause erosion damage include particulate erosion, liquid droplet erosion, vapor droplet erosion, erosion-corrosion, and cavitation.
Particulates (sand and proppant) underlie most erosion problems in hydrocarbon processing systems. However, all mechanisms can be equally aggressive, depending on conditions. Directional flow changes or accelerated flow velocity contribute to erosion of production components. The most vulnerable components include chokes, sudden constrictions, partially closed valves (check valves and valves that are not full bore), standard radius elbows, weld intrusion and pipe bore mismatches at flanges, long radius elbows and mitered elbows, blind tees, and straight pipes.1
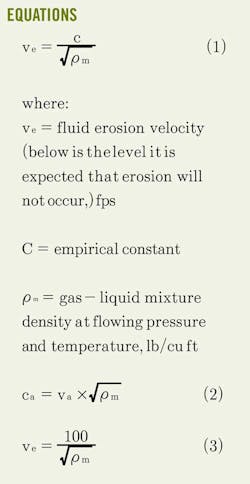
To avoid or mitigate erosional damage, American Petroleum Institute Recommended Practice (API RP) 14E recommends limiting tubing and pipeline velocity. This standard uses Equation 1 (accompanying equations box) to determine the threshold (erosional) velocity.
Although there is no information about why API RP 14E uses Equation 1, the erosional velocity may have been derived from the constant pressure drop limitation that uses the Bernoulli relationship, erosion rate limits arising from liquid impingement, or velocity limits to avoid removing corrosion inhibiting layers.2
Regardless of the API RP 14E erosional equation basis, current industry experience indicates that for solids-free fluids, values of C = 100 for continuous service and C = 125 for intermittent service are conservative. For solids-free fluids in which corrosion is not anticipated or is controlled by inhibition or use of corrosion resistant alloys, values of C = 150 to 200 may be used for continuous service. C values up to 250 have been successfully used for intermittent service.
If solids production is anticipated, fluid velocities should be reduced. Different C-values can be used when specific application studies show them to be appropriate.3 Within the industry, the popularity of Equation 1 for primary design and for oil and gas production systems operations arose from its simplicity. The wide use of the API RP 14E erosional formula, however, does not negate its weaknesses.
Many reports of conservatism exist in API recommendations under pure fluid conditions because they may not be conservative enough for systems with sand production. API RP 14E clearly states that different C-values may be used where specific application studies have shown them to be appropriate; however, many workers attempt to define C-factors for several different circumstances, including systems containing solids, different materials, or phases (i.e., liquid, gas, or multiphase).4
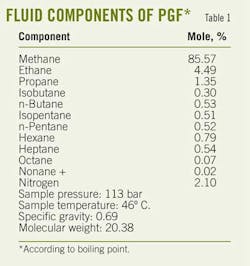
The trial reported here focused on an onshore gas condensate field in southern Iran, the Parsian gas field (PGF), which is a large sweet-gas condensate reservoir. Operator South Zagros Oil & Gas Production Co. exceeded API RP 14E recommendations to determine greater C-factor values for the erosion formula. Table 1 shows the gas composition of PGF.
Because production potentials of four wells exceeded expectations, they were selected for velocity increases by means of increasing their production. After 6 months of increased production, a combination of surface monitoring tools and tube caliper surveys was used to examine tubing and wellhead components and analyze the higher velocity effect on wall thickness.
The surface monitoring tools consisted of weight-loss coupons, electrical resistance (ER) probes, non-destructive testing (NDT), visual inspections, and a test separator to monitor sand accumulation. A decision was made to determine a greater but still safe C-factor for use in the API erosion formula for both future PGF wells and the field development plan.
PGF production began about 8 years ago. Soon after start-up, the operator decided to investigate the possibility of enhancing individual wells' production for two reasons. First, alloy steel used for well tubing and flow lines could resist more aggressive erosion and corrosion conditions than were present in the field. Second, the production potential of some wells was greater than was anticipated from their design.
Increased production of individual wells could enable the gas-condensate target volume to be met with fewer wells, reducing the number required in future development plans and reducing drilling expenses. Although this was an attractive possibility, other factors must be considered.
First, increased velocity could cause tubing failure and require well shutdowns if the tubing material cannot withstand the shear stress resulting from the increased velocity. Because of the cost of replacing damaged tubing, well production should increase incrementally with short inspection intervals and frequent wall thickness monitoring. Erosion-corrosion damage in surface components is easier to recognize and resolve than in downhole equipment; repair and replacement of surface facilities is less expensive than repairs to downhole equipment.
Second, increased production may alter the formation and increase sand production. Because sand can affect the erosion rate, the possibility of sand production must be monitored during field trial. Although the core analysis performed for the formation indicated that the wells selected for increased velocity would not produce sand, the trial would place a test separator at the gas gathering manifold to monitor for sand production as a precaution. If wells tend to produce sand, then the test separator is a good place to monitor for sand.
Selected wells' trial conditions
The PGF primary well completion design focused on reaching an average individual well production of 53 MMscfd. This value corresponded to a flow velocity of 37 fps in 4.67-in. ID tubing. Most of the well completions used 5½-in. OD/4.67 ID, N-80 tubing inside and 6-in. wellhead flow lines. Table 2 compares actual velocity (va) during the trial and designed API erosion velocity (ve) used before the trial for the four selected wells. Production varied from 78 to 99 MMscfd; actual through-tubing velocity varied from 54.7 to 73.7 fps. Equation 2 shows the recalculation of the actual C-factor (Ca) in accordance with API RP 14E.
Furthermore, the ve value calculated with the API RP 14E formula was based on C = 100 for all wells. The initial PGF well design was based on a value of C = 100 in API RP 14E to avoid or mitigate erosion in downhole tubing.
Table 2 summarizes the mixture densities calculated for individual well conditions.
Downhole monitoring
Caliper surveys provide downhole corrosion-erosion information; the survey costs (including hourly rig rates and well downtime), however, limit their use. The caliper device records internal dimensions of the tube along several independent equally-spaced tracks to create a 3D profile of the line. The results identify circumferential erosion-corrosion, trough or line corrosion, and isolated pitting and corrosion at the tubing connection.5
Before the trial began, a caliper survey was performed on each of the four selected wells to scan the wall thickness of the entire tubing column. After 6 months of increased production, tubing caliper surveys were performed on each well to determine the tubing wall thickness loss.
The rate of material loss at the top of the tubing was greater than in the lower parts. This loss resulted from increased velocity and the changing flow regime in upper portion of the tube. Caliper logs for each well include many point measurements of tube thickness from top to bottom of the available depth.
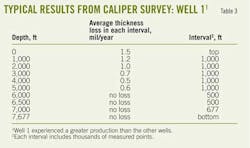
Table 3 presents an average wall-loss rate for each interval, based on the thickness measurements before and after the trial. Table 4 compares caliper results and the coupons and probes results.
A good correlation existed between the coupons, probes, and caliper survey results. The material loss recorded by the caliper represents an average value over the entire length of a tube calculated for each well. Before the trial, the wall loss rate of Well 1 was expected to exceed that of other wells because of its greater production. The caliper survey and coupons and probes results confirmed this expectation. The caliper surveys showed no severe pitting throughout the tubing column of the selected wells; with current conditions, tubing could last for 30 years of production.
Surface monitoring
Surface monitoring processes used corrosion coupons, ER probes, NDT, visual inspection of surface components, and a test separator. Sizes and configurations of corrosion coupons vary; the appropriate size and configuration depends on holder type, line size, and entry orientation. The trial used disk-type weight-loss coupons of 32 mm diameter × 3.2 mm thick mounted flush inside the pipe wall.
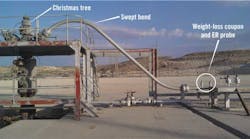
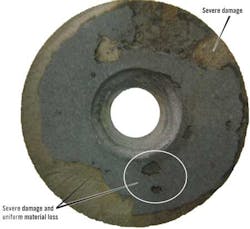
The ER probes, like the flush-mounted weight-loss coupons, were disk-type sensors that aimed to provide continuous monitoring of the pipe service condition. The coupons and probes were installed after a swept bend upstream of the wellhead choke. Fig. 1 shows the location of the installed coupon and probe at a wellhead. After 6 months of production, the weight-loss coupons were retrieved and the mass loss was measured. Fig. 2 illustrates a typical weight-loss coupon after the laboratory cleaning process.
For reliable results, ER probes' data were gathered at 2-month intervals without interrupting well performance. Results from coupons and probes were compared with those from the tube caliper survey summarized in Table 4.
The caliper results showed less thickness loss than indicated by the coupon and probe data. There are two reasons for this inconsistency.
1. The surface components include more liquid content than the well column; increased liquid content can increase material loss from surface coupons and corrosion probes.
2. For reliable results, ER probes data were gathered at 2-month intervals without interrupting well performance.
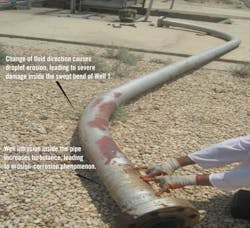
In addition, the coupons and probes were located immediately after the swept bend of the christmas tree; the fluid flow turbulence is greater in this section than in the straight well tubing. Turbulence increases erosion-corrosion effects and material loss of the coupon and probes.
Study results indicate that tubing material loss for all wells was within an acceptable range; no unexpected problems should arise from production rates up to 99 MMscfd, which correspond to a velocity of 74 fps.
During the trial, ultrasonic thickness probes were used as a NDT means of measuring wall thickness of critical points of the surface components. This technique is limited in that it tests only a short pipe region. Critical points around swept bends, joint flanges, up and downstream of chokes, and on straight pipes were selected and marked for repeat measurements.
After 3 months, ultrasonic probes results revealed thickness loss at swept bends of Well 1 and downstream of some chokes. Severe erosion or erosion-corrosion was expected at these locations. The trial continued with special attention to these locations.
After the trial, the wells were shut down for coupon retrieval, and wellhead components (including swept bends, chokes, and spools) were disassembled for visual inspections. A visual inspection of locations at which ultrasonic probes detected thickness loss revealed no problems except at the swept bend in the well with the highest velocity and at the "X" choke in the well with the lowest gas rate.
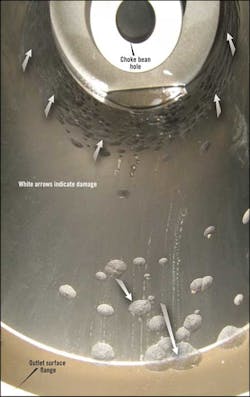
Although wells included in the trial used choke valves of either "X"or "Y" types, distinctive damage occurred only on the X valves at the inlet and outlet face flanges and inside the choke body (Fig. 3). This type of damage had occurred before the trial, but with much less intensity.
Tables 5 and 6 show that operational conditions, material compositions, and general specifications of the two chokes are similar; the geometries of the choke outlets provide possible explanations for the damage differences observed. The X choke features a cylindrical geometry, whereas the Y choke geometry is conical.
The conical geometry was thought to protect Y chokes from droplet erosion, erosion-corrosion, and possibly cavitation in high-volume rates through the choke. Although studies of the X choke failure causes have not yet been completed, X chokes are not considered suitable for high-off take gas condensate wells.
The swept bend of Well 1 showed major damage. Figs. 4 and 5 illustrate a dismantled swept bend wellhead component and the inside wall damage. Because Well 1 had the greatest production, the swept bend damage could be attributable to intensive impingement of droplets on the internal pipe wall. The loss of thickness, however, should not prevent increased production because it is located on surface and can be replaced if a failure occurs.
Frequent inspections of high production wells with NDT tools would provide a reasonable means of tracking this damage. Internal coatings or the use of a high erosion-corrosion resistant alloy also address severe thickness loss at swept bends. The wellhead equipment inspection revealed that general destruction issues for PGF include erosion-corrosion of spools and straight pipes, droplet erosion on swept bends, and a possible combination of erosion-corrosion, droplet erosion, and cavitation on fixed choke valves, particularly X-type choke valves.
A test separator at the gas gathering manifold monitored sand during the trial. Visual inspection during and after the trial showed no sand or proppant accumulation in the separator vessel. From the core analyses performed during reservoir integrity testing before the trial, this result was expected.
As shown in Table 4, increased production to 99 MMscfd does not reduce tubing wall thickness. Results from surface component inspections revealed no unexpected damage to the equipment, except for the swept bend of Well 1 and the fixed choke of Well 4.
The maximum and minimum calculated C-factors (ca) of 195 and 149 respectively were well above the assumed value of C = 100 for all wells at their initial design. Although no unexpected erosion damage occurred at these rates, the company elected to use a secure C-value that represents an average taken from all four wells (i.e., C = 170) as the threshold tubing velocity for tubing during future field development.
The trial indicates that the X-type choker valve is not suitable for PGF high off-take gas condensate wells and that the swept bend component is vulnerable to thickness loss during high gas production. It also confirms that no sand will be produced at rates of up to 99 MMscfd. As expected, the general damage mechanism for this field is the erosion-corrosion phenomenon.
References
1. Barton, N.A., "Erosion in Elbows in Hydrocarbon Production Systems: Review Document," HSE Health & Safety Executive, HSE Books, 2003, www.hse.gov.uk/research/rrpdf/rr115.pdf.
2. Salama, M.M., and Venkatesh, E.S., "Evaluation of API RP14E Erosional Velocity Limitations for Offshore Gas Wells," Offshore Technology Conference, May 2-5, 1983, Houston.
3. API Recommended Practice (RP14e), "Recommended Practice for Design and Installation of Offshore Production Platform Piping Systems," 5th Edition, October 1991.
4. Sun, Y., Babian-Kibala, E., Hernandez, S., Martin, J.W., and Alvarez, J., "Design and Operations Guidelines to Avoid Erosion Problems in Oil and Gas Production Systems – One Operator's Approach," NACE CORROSION 2006, Mar. 12-16, 2006, San Diego.
5. Houghton, C.J., and Westermark, R.V., "North Sea Downhole Corrosion: Identifying the Problem; Implementing the Solutions," Offshore Technology Conference, May 3-6, 1982, Houston.
The authors
Hamed Mansoori ([email protected]) has more than 9 years of experience with the National Iranian Oil Co. as a process engineer. He holds a BSc in chemical engineering from IAU, Iran, and a MSc in chemical process engineering from Shiraz University, Shiraz, Iran.
Feridun Esmaeilzadeh ([email protected]) is associate professor at Shiraz University, joining in 2002, and adjunct professor at the Sharif University of Technology since 2001. He has more than 10 years of experience at the National Iranian Oil Co. as an administrator of reservoir simulation, production engineering, and petrophysics. Esmaeilzadeh holds a BS from Abadan Institute of Technology, Abadan, Iran, MS from Shiraz University, Shiraz, Iran, and PhD from Sharif University of Technology, Tehran, all in chemical engineering. He is a member of the Society of Petroleum Engineers and the Iranian Association of Chemical Engineering.
Dariush Mowla ([email protected]) is professor of chemical engineering and head of the Environmental Research Center in Petroleum and Petrochemical Industries at Shiraz University. Mowla holds a PhD from INP de Toulouse in France and joined Shiraz University in 1992. He has published more than 90 papers in international journals and participated in more than 100 national and international conferences.
A. Hassan Mohammadi ([email protected]) is the operation manager of South Zagros Oil & Gas Production Co. with 20 years of experience in the petroleum industry. He holds a BSc in chemical engineering from Shiraz University, Shiraz, Iran, and a MSc in chemical engineering from Tehran University.

