Equations predict wellbore pressure, liquid loading in high GOR wells
Jie Yi Shun-Li He Leng Tian Ji-Xiang Ma
China University of Petroleum
Jun-Jian Wang
China University of Geosciences
Beijing
Unique behavior of gas condensate wells is characterized by rapid well production loss. Condensate rapidly builds up around the wellbore, reducing gas permeability and gas deliverability, when the flowing bottomhole pressure (BHP) drops less than the dewpoint. To improve the final recovery, the production system must be optimized.
A task lies in accurately predicting the wellbore pressure drop because multiphase flow prevails in the wellbore as well as in gas and oil transmission and distribution pipelines. Physical phenomena, such as turbulence, flow regime transitions, and thermodynamic phase changes with pressure and temperature, occur in the wellbore. Consequently, tools currently applied to pure oil fields often produce erroneous predictions.
Many studies have investigated wellbore pressure drop in gas condensate wells. Yang1 presented a method for calculating wellbore pressure drop in gas condensate wells by using a pseudo mixture approach. Trick2 compared correlations for predicting wellbore pressure losses in gas-condensate and gas-water wells and analyzed the adaptability of those methods.
Zhu et al.3 used the homogeneous approach to calculate pressure drop in gas condensate wells. Sadegh et al.4 proposed a simplified model based on physical principles, incorporating current hydrodynamic and thermodynamic methods. Meng et al.5 presented a method that considers the phase changes, temperature, and flow regime transitions at the same time.
These methods, however, have several disadvantages. First, the mass transfer between the gas and condensate phase is not considered with changes in temperature, pressure, and composition. Second, the distribution of a critical liquid-carrying flow rate is not calculated; the liquid-loading estimate uses only the wellhead values.
This article describes forecasting wellbore pressure and liquid loading in gas condensate wells under high GOR conditions. Fog flow dominates in gas condensate wells when the production GOR exceeds 1,500 cu m/cu m; consequently, the flow regime transitions no longer must be considered.
Pressure distribution
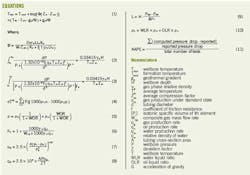
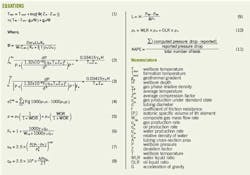
The wellbore temperature distribution acquired with the Xue et al.6 model considers the influence of liquid and applies to gas condensate wells (Equation 1). Pressure and temperature control condensate in the wellbore. For the same well flow, changes in the wellbore temperature distribution also change the BHP; consequently, the wellbore temperature cannot be calculated by a linear relationship only.
The wellbore distribution model requires that the deviation factor, viscosity, density, and production be corrected with a fluid phase equilibrium flash calculation and equation of state. The wellbore pressure drop was calculated with the average temperature and average compression coefficient, as described by Yang1.
Equation 2 shows the formula used to calculate wellbore pressure drop without considering water.
When the gas condensate well includes water production, the well flow contains gas condensate, gas, and water; this flow can be simplified as flow of water and composite gas composed of gas condensate and gas. Because water must be considered in wellbore pressure-drop calculations, the water correction coefficient Fw is used to express the influence of water, which changes the wellbore pressure-drop calculation formula to that shown in Equation 3.
Because the liquid production of high GOR wells is low and gas production is relatively high, the wellbore flow type is primarily fog flow, sometimes accompanied by annular flow and mixing flow. The parameters are corrected with quasi single-phase, as described by Li et al.7 The composition, density, and deviation factor of gas and liquid, respectively, can be acquired with a gas liquid equilibrium flash calculation. Next, the methods described in the following paragraphs to correct parameters will determine mixture viscosity, gas-liquid interfacial tension, and the water correction coefficient.
Fluid viscosity can be obtained by many methods. The residual viscosity method is usually used to calculate condensate oil and gas viscosity, and gas mixture viscosity (μ0gm) under low pressure must be calculated first.
Under medium pressure and temperature, mixture viscosity can be acquired with the method applied to low-pressure combination of gases; under high pressure, it must be modified.
The gas-liquid interfacial tension varies with the composition of gas and liquid, which in turn, changes with well depth. Equation 4 calculates gas-oil interfacial tension by the Macleod-Sugden formula. Equation 5 calculates the gas-liquid interfacial tension. Equation 6 provides the calculation for the water correction coefficient.
Liquid loading
When gas production exceeds fluid production, the liquid phase will disperse in the gas phase as liquid droplets and will be carried to the surface by the gas phase. Only when the gas production rate passes a critical fluid-carrying flow rate will all liquid be carried out; otherwise, some condensate oil and water will accumulate in wellbore and form wellbore liquid loading.8 9
Many methods and models have been proposed to calculate the critical liquid-carrying flow rate; the earliest model is the droplet model established by Turner et al.10 Based on the mechanical balance principle, Turner calculated the critical liquid-carrying flow rate and increased it by a 20-30% correction in the field application.
Rather than modify the calculation, however, Coleman11 proposed correcting the parameter in Turner's formula. Considering the influence of the Reynolds number, Nosseir12 also built a model at ranges from 3×10⁵ to 5×10⁶ of the Reynolds number. Li et al.13 considered the deformation of the liquid droplet and deduced a new formula.
Turner's model assumes that the liquid droplet entrained in gas is spherical. When a liquid drop is entrained in a high-velocity gas stream, however, a pressure difference exists between the fore and aft portions of the liquid drop. This pressure difference deforms the drop, and the shape changes from spherical to ellipsoidal. Based on this assumption, Li et al.13 proposed a new model to calculate the critical liquid-carrying flow rate (Equation 7). Equation 8 calculates the critical liquid-carrying flow rate.
In Equation 8, the density of the gas and the liquid, interfacial tension, deviation factor, cross-sectional tubing area, temperature, and pressure control the critical liquid-carrying flow rate. Influenced by retrograde condensation, the liquid behavior, temperature, and pressure vary with well depth, which changes the critical liquid-carrying flow rate in the wellbore. Obviously, liquid loading cannot be determined with only the critical liquid-carrying flow rate in the wellhead or bottomhole.
Therefore, based on the Li13 model, the critical liquid-carrying flow rate of the entire wellbore was used to calculate the well liquid loading. Distribution of the critical liquid-carrying flow rate and the wellbore pressure were calculated simultaneously. The calculated results were then compared with the measured value.
If the measured flow rate exceeds the calculated flow rate, then no liquid loading is occurring. If the calculated flow rate exceeds the measured flow rate, then liquid loading is occurring.
The analysis indicates that the deviation between the calculated and measured BHP is caused by the liquid loading at the well bottom. Therefore, based on the difference between calculated BHP Pwf1 and measured BHP Pwf2, Equations 9 and 10 can calculate the depth of the liquid loading.
If the flowing BHP has not been measured, the time that liquid loading occurred can be used to estimate qualitatively the degree of liquid loading.
Distribution model
After development of the phase characteristic modeling, wellbore temperature prediction, and quasi single-fluid calculation, these components were integrated to create the wellbore model. The Tazhong I gas condensate field, in the Tarim basin of Xinjiang China, was used for analyzing the model's sensitivity and validating the model.
Tazhong I gas condensate field lies in the Tazhong I faulted slope break zone of the northern Tazhong low-uplift. The Tazhong low-uplift lies in the central Tarim basin central uplift and is an inheritance paleo-uplift long-term development. The area is about 9,300 sq km (about 5,800 sq miles). It is 200 km long from east to west and 25 to 40 km wide from north to south.
Tazhong I gas condensate field is part of a laminated carbonate condensate gas reservoir. The formation is controlled by the fault belt, the structure belt, and the Manjiaer depression. Use of casting slice, core description, and cave-fracture statistics helped determine the primary reservoir space of this reservoir to be a complex association of macroscopic cracking, solution cavity, corroded hollow, and intercrystalline suture.
The upper Ordovician reefs and banks and the lower Ordovician Yingshan formation are classified as a two-layer series of development. The average thickness is 40 to 50 m. The reservoir is low porosity and low permeability. Core analyses show that in 80.69% of the core, the porosity of the matrix is less than 1.8%, and that in 79.9% of the core, the permeability is 0.01~3×10⁻³μm2.
This gas field, discovered in 2002, was first put into production in 2004. As of August 2012, it included about 118 producers. Because of the formation features, the well pattern is irregular, and well spacing is about 700 m. The water cut is 26.23%.
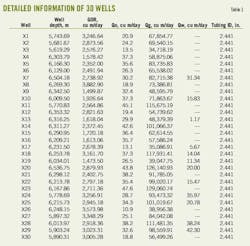
A mixture of oil, gas, and water moves to the gas intermediate treatment plant from the wellhead. After the oil and gas are separated, the oil, gas, and water can be measured. After careful evaluation, 30 well cases were selected to test the model, and data from these wells were gathered from the Aug. 9, 2012 field report. Table 1 provides detailed information about these wells.
The average absolute percent error (AAPE) was used to analyze test results by comparing the reported and predicted pressure drops. The influences of absolute roughness, wellbore section length, tubing diameter, GOR, and wellhead pressure were evaluated separately. After analysis of the absolute roughness and section length of the wellbore, the effect of errors in tubing diameter, GOR, and wellhead pressure were also investigated. Equation 11 shows the AAPE calculation.
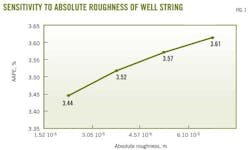
The first parameter evaluated was absolute roughness of the well string. The model was run with absolute roughness values of 0.5 ×10⁻⁴ ft, 1.0 ×10⁻⁴ ft, 1.5 ×10⁻⁴ ft, and 2.0 ×10⁻⁴ ft (Fig. 1). The roughness parameter had a small effect on the model's accuracy. The AAPE ranged from a maximum of 3.61% for a roughness of 0.5 ×10⁻⁴ ft to a minimum value of 3.44% for a roughness of 2.0 ×10⁻⁴ ft. This value was used for all subsequent validation runs.
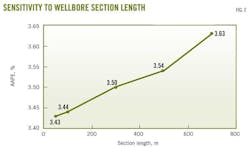
Selection of the wellbore section length was tested with interval values of 50, 100, 300, 500, and 700 m (Fig. 2). When the wellbore section length exceeded 100 m, the AAPE increased rapidly to 3.63% at a section length of wellbore of 700 m (Fig. 2). The AAPE changed slightly around the value of 3.44% when the section length of the wellbore was less than 100 m; however, the computation time increased substantially. Consequently, a wellbore section length of 100 m was used for all subsequent validation runs.
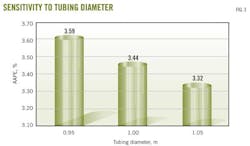
Fig. 3 shows the results obtained when the tubing diameter is changed by ±5%. The model was less sensitive to changes in tubing diameter. When a tubing-diameter value of 95% of the actual value was used, the AAPE increased to 3.57% from 3.44%. When a tubing-diameter value of 105% of the actual value was used, the AAPE decreased to 3.32% from 3.44%.
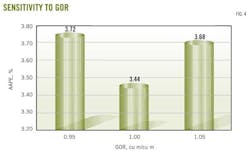
Fig. 4 shows that the model was sensitive to changes in the reported GOR. In general, the reported values seem to produce the most accurate predictions, whereas decreasing the reported GOR by 5% caused a 0.28% increase in AAPE. Conversely, increasing the reported GOR by 5% caused a 0.24% increase in AAPE.
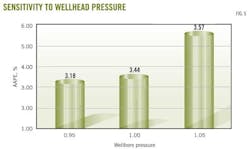
The model is sensitive to changes in the reported wellbore pressure. Fig. 5 shows the results obtained when the reported wellbore pressure is changed by ±5%. Reducing the reported wellbore pressure by 5% decreases the AAPE by 0.26%, whereas increasing the reported wellbore pressure by 5%, increases the AAPE to 5.57% from 3.44%.
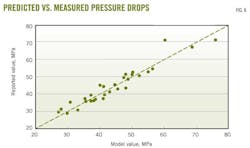
Fig. 6 shows a plot of the measured pressure drop vs. the predicted pressure drop. The model and reported values closely correlate. The AAPE was about 4.81% with the greatest error being around 9.78%. Because the results of the similar tests were good, the error likely originated from the reported values.
Predicting liquid loading
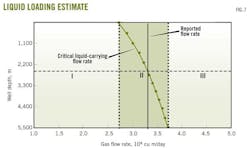
Fig. 7 shows liquid loading in Well X3. In this example, the reported flow rate was less than the critical liquid-carrying flow rate at a well depth of more than 2,500 m. Consequently, liquid at a depth of more than 2,500 m cannot be carried to the surface and will fall to the bottom of the well. In this condition, the use of only the wellbore values can no longer accurately predict liquid loading.
Gas well liquid loading can be classified into one of three groups, depending on the reported flow rate (Table 2). This classification system was used to assess the wellbore liquid loading of 30 selected well tests. The results show that 6 tests fell in Group I, 9 tests fell in Group II, and 15 tests fell in Group III. The comparison of the model and reported values shows a close correlation and the consistency was up to 95%; consequently, this method accurately assesses the condensate gas well liquid loading.
References
1. Yang, J.S., "Gas Production Techniques," Beijing: Petroleum Industry Press, 1992.
2. Trick, M.D., "Comparison of Correlations for Predicting Wellbore Pressure Losses in Gas-Condensate and Gas-Water Wells," paper 2003-019 presented at the Canadian International Petroleum Conference, June 10-12, 2003, Calgary.
3. Zhu, J.H., Hu, Y.Q., and Zhao, J.Z, "Calculation of Wellbore Pressure for Condensate Wells Under Influence of Phase State Changing," J. Natural Gas Exploration & Development, 2006, p. 18-20.
4. Sadegh, A.A., Zaghloul, J.S., and Adewumi, M.A., "Gas/Condensate Wellbore Modeling Using a Fundamental Approach," paper SPE 102479 presented at the SPE Annual Technical Conference and Exhibition, Sept. 24-27, 2006, San Antonio.
5. Meng, Y.X., Li, X.F., and Yin, B.T., "Calculation of Wellbore Pressure for Condensate Wells," J. Engineering Thermal Physics Journal, Vol. 31 (2010), pp. 1508-1511.
6. Xue, X.M., Li, X.F., and Wu, Y.F., "Calculating Method of Wellbore Temperature Distribution for Gas Well with High Gas/Liquid Ratio," J. Natural Gas Industry, Vol. 26 (2006), pp. 102-104.
7. Li, S. L., Sun, L. T., and Guo, P., "Gas and Gas Condensate Field Development," Beijing: Petroleum Industry Press, 2005.
8. Veeken, C.A.M. and Belfoid, S.P.C., "New Perspective on Gas-Well Liquid Loading and Unloading," paper SPE 134483 presented at the SPE Annual Technical Conference and Exhibition, Sept. 19-22, 2010, Florence.
9. Ilobi, M.I. and Ikoku, C.U., "Minimum Gas Flow Rate for Continuous Liquid Removal in Gas Wells," paper SPE 10170 presented at the SPE Annual Technical Conference and Exhibition, Oct. 4-7, 1981, San Antonio.
10. Turner, R.G., "Analysis and Prediction of Minimum Flow Rate for the Continuous Removal of Liquids from Gas Well," J. Journal of Petroleum Technology, Vol. 21, No. 11 (November 1969), pp. 1475-1482.
11. Coleman, S.B., Clay, H.B., McCurdy, D.G., and Norris, H.L. III, "A New Look at Predicting Gas-Well Load-Up," J. Journal of Petroleum Technology, Vol. 43, No. 3 (March 1991), pp. 329-333.
12. Nosseir, M.A., Darwich, T.A., and Sayyouh, M. H., "A New Approach for Accurate Prediction of Loading in Gas Wells Under Different Flowing Conditions," paper SPE 37408 presented at the SPE Production Operations Symposium, Mar. 9-11, 1997, Oklahoma City.
13. Li, M., Sun, L., and Li, S.L., "New View on Continuous-Removal Liquid from Gas Wells," paper SPE 75455 presented at the SPE Permian Basin Oil and Gas Recovery Conference, May 15–16, 2002, Midland, Tex.
The authors
Yi Jie ([email protected]) is working toward a masters degree at China University of Petroleum, Beijing, and expects to complete the degree in 2014. Her main research interests are modern gas well tests and gas reservoir engineering.
He Shun-Li ([email protected]) is a professor at China University of Petroleum, Beijing. His main research interests are modern gas well tests and gas reservoir engineering. He holds a PhD in seepage mechanics from Fourier University, France.
Ma Ji-Xiang ([email protected]) is working toward a masters degree at College of Petroleum Engineering, China University of Petroleum, Beijing and expects to complete the degree in 2014. His main research interests are modern gas well tests and gas reservoir engineering.
Tian Leng ([email protected]) is a lecturer at China University of Petroleum, Beijing. His main research interests are modern gas well tests and gas reservoir engineering. Leng holds a PhD in petroleum field development from China University of Petroleum, Beijing.
Wang Jun-Jian ([email protected]) is working toward a masters degree at China University of Geosciences, Beijing and expects to complete the degree in 2013. His main research interests are coalbed methane and shale gas.
