Worldwide reserves, oil production post modest rise
Conglin Xu
Senior Editor-Economics
Laura Bell
Statistics Editor
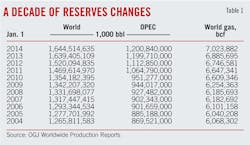
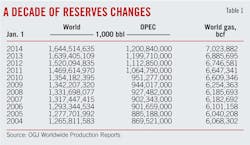
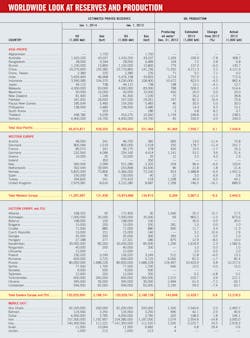
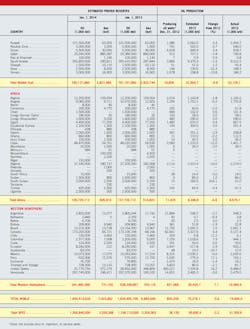
Worldwide oil and gas reserves estimates have increased slightly from a year ago, according to OGJ's latest survey of proved reserves.
Total oil reserves are now estimated at 1.64 trillion bbl, while the world's gas reserves are 7.02 quadrillion cf, up 0.4% and 2%, respectively, from a year earlier. The share of the world's reserves that are located in member countries of the Organization of Petroleum Exporting Countries declined from the previous survey for both resources.
Worldwide oil production edged up nearly 1% in 2013, led by higher production in the Western Hemisphere. OPEC oil production is estimated to have declined 2.2% from a year ago.
Reserves changes
The published reserves figures rely on survey responses and official updates released by individual countries, which are not provided every year in many cases. OGJ changes its estimate for a particular country only when it receives evidence that a change is in order. Therefore, in a given reserves summary, a year-to-year change—or lack thereof—may not necessarily reflect a change that applies to the calendar year alone.
Led by the US, the Western Hemisphere is the region with the largest reserves changes in absolute terms. The collective proved oil reserves in North America and Latin America are up 0.6% to 541 billion bbl and gas reserves are up 4% to 731 tcf.
Mexico's Petroleos Mexicanos (Pemex) reported that, as of Jan. 1, proved crude oil reserves totaled 10 billion bbl, 61% of which consisted of heavy crude oil, 29% of light crude oil, and the remaining 10% of extra-light crude oil.
The Canadian Association of Petroleum Producers pegs crude oil and condensate reserves steadily at 173.2 billion bbl. Canada's gas reserves are now 66.7 tcf, down from 68 tcf as reported a year ago.
Brazil's oil reserves increased only slightly—0.4% to 13.2 billion bbl—while its proved gas reserves slid 1.4% to 13.7 tcf. Colombia, Peru, and Argentina each reported higher oil and gas reserves.
Reported oil reserves increased 3.8% in Western Europe, and gas reserves for this group of countries declined 2.5%. The most recent estimates put Norway's proved gas reserves at 73.8 tcf and crude oil and condensate reserves at 5.8 billion bbl. Austria, Denmark, France, and Italy each reported higher oil reserves and lower or flat gas reserves, while the UK and Germany registered sizable declines in both reserves.
In the Asia-Pacific region, the largest change in proved reserves occurred in China, based on new information from the country's land and resource ministry. Boosted by technological advancements, proved oil reserves in China exceeded 24 billion bbl, up 659 million bbl from last year. Gas reserves climbed 10% to 155 tcf.
Proved gas reserves for Mozambique has been updated to 100 tcf from 4.5 tcf as reported in the previous report. A group led by Anadarko Petroluem Corp. has discovered the Prosperidade and Golfinho/Atum complexes on the Area 1 block, believing that 35 tcf to more than 65 tcf is recoverable. A group led by Italy's Eni SPA on the Area 4 block has discovered the Mamba complex consisting of Mamba and Coral fields with an estimated 80 tcf of gas in place and the Agulha discovery on the southern part with an estimated 5 to 7 tcf.
The probable reason OGJ updated the Mozambique gas reserves is because the exploratory wells that the two companies used to arrive at the above estimates have been drilled in 2010, 2011, 2012, and drilling has continued into 2013.
OPEC reserves
OPEC's crude oil and condensate reserves estimate currently stands at 1,200.84 billion bbl, compared with 1,199.7 billion bbl in the previous report. The data come from the OPEC Annual Statistical Bulletin.
The organization now holds 73% of all crude oil and condensate reserves, down from 73.1% a year ago and 73.2% in 2011. OPEC also controls 48% of total natural gas reserves vs. 49% a year ago.
Saudi Arabia's crude oil and condensate reserves are estimated at 265.8 billion bbl, up 440 million bbl from the previous estimate. The estimate of gas reserves there has been increased 1% to 290.8 tcf.
Reported oil reserves declined 13.5% in Angola to 9.1 billion bbl, and gas reserves declined almost 25% to 9.7 tcf. However, the country claims that it has 4 billion bbl more in oil reserves than OPEC estimate.
US reserves
By yearend 2011, the US had 29 billion bbl of proved oil reserves, a 15% increase from the 25 billion bbl in 2010, according to the US Energy Information Administration. Proved reserves of US gas rose by 31.2 tcf in 2011 to a new record high of 348.8 tcf.
EIA said record increases in proved oil and gas reserves in 2011 were attributable to horizontal drilling and hydraulic fracturing in shale and other tight formations, as well as higher oil prices. Lower gas prices had a dampening effect on proved gas reserves.
In 2011, Texas had the largest increase of 1.8 billion bbl, resulting mostly from ongoing development in the Permian and Western Gulf basins in the western and south-central parts of the state. North Dakota registered the second- largest increase, 771 million bbl, driven by development activity in the Williston basin. Combined, North Dakota and Texas contributed to two thirds of the net increase in total US proved oil reserves in 2011.
Collectively, Texas and Pennsylvania added 73% of the net increase in US proved wet gas reserves. Pennsylvania's proved gas reserves more than doubled in 2010, rose an additional 90% in 2011, contributing 41% of the overall US increase.
"Expanding shale gas developments in these and other areas, particularly the Pennsylvania and West Virginia portions of the Marcellus formation in the Appalachian basin, drove overall increases," EIA said.
EIA's upcoming 2012 data will be released in early 2014. OGJ made its own estimates for 2012 by arbitrarily adding 75% of the EIA previous year-to-year change just to keep our new numbers conservative.
Oil production
OGJ estimates that worldwide crude oil and condensate production averaged 75.3 million b/d, compared with 74.7 million b/d a year ago. Actual production in 2011 was 73.6 million b/d.
OPEC output in 2013 reported a 2.2% decline, reflecting supply outages among some OPEC producers, along with an average annual decrease in Saudi Arabia's production. Saudi Arabia's output in 2013 is forecast to average 9.3 million b/d, down 1.4% from a year ago. Iran's production is down 15% to 2.5 million b/d because of the effects of US and European Union sanctions. Production in OPEC's African members, including Nigeria, Libya, Algeria, and Angola, is expected to be collectively crippled 8.4% by political turmoil.
Despite the production increase in South Sudan, total Africa output is about to fall 5% to 8.25 million b/d this year, with sizable declines in Libya and Nigeria.
Western Hemisphere oil production in 2013 was buoyed by increases in US and Canada, pushing up that region's estimated output 7.1% from last year. US production of crude oil and condensate will increase 16.2% in 2013 to 7.5 million b/d. Canada production is forecast to climb 6.4% to 3.3 million b/d.
The largest regional loss in oil production this year was in Western Europe, which posts an estimated 9.3% decrease to 2.7 million b/d. North Sea oil and gas production has recorded the biggest annual slump due to maintenance on aging infrastructure.
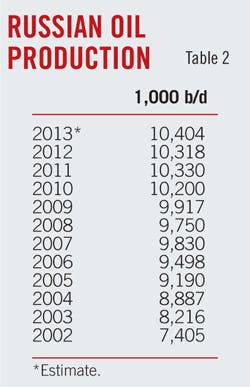
Production in Russia this year averages 10.4 million b/d, compared with 10.3 million b/d last year (Table 2). The countries of Eastern Europe and the former Soviet Union collectively are expected to post a modest increase in output at 1% in 2013.
In the Asia-Pacific region, collective oil output this year is also steady with a year earlier, OGJ forecasts. Average oil production in China for 2011 will be little changed at 4.09 million b/d.
OGJ subscribers can download, free of charge, OGJ Worldwide Report 2013 tables from the OGJ Online home page at www.ogjonline. Click "OGJ Subscriber Surveys," then "Worldwide Production" or "Worldwide Refining." Historical spreadsheets of data presented here are available for purchase from PennEnergy Research. Visit www.ogjonline.com, and click the "Research" tab.
R-P ratios
At the 2013 rate of production and current reserves estimates, US has almost 12 years of oil production remaining. Excluding oil sands, Canada's reserves to production ratio is 4 years. Saudi Arabia's current reserves estimate would last another 77 years, and Kuwait's reserves would produce at its current rate for 105 years.
