Testing backfill's thermal conductivity improves operations
Yutian Li
Changchun Wu
Xiaokai Xing
China University of Petroleum
Beijing
Dan Dou
CNPC Niger Petroleum SA
Niamey, Niger
Yang Yu
China University of Petroleum
Beijing
Increases in backfill soil's thermal conductivity can cause sharply higher heating station fuel costs on heavy oil crude pipelines because the higher conductivity requires a higher initial temperature to keep the crude's terminal temperature stable.
Excavation and filling change not only the compactness and water content of backfill soil, but also its thermal conductivity. Backfill soil's thermal conductivity in turn affects the cooling of a hot oil pipeline, and through this, its energy consumption, safety, and budget.
This article analyzes the characteristics of backfill soil thermal conductivity along a buried pipeline, explains the principle of the line heat source method used for measuring soil thermal conductivity, and introduces field thermal needle system FTN01 as a tool for determining thermal conductivity.
Taking soil thermal conductivity field testing results at the Niger hot oil pipeline project as an example, the article summarizes distribution rules and the main factors influencing backfill soil thermal conductivity in the West Africa tropical desert, tropical grassland, and farmland areas. The testing and analysis methods introduced can be used to determine backfill soil thermal conductivity distribution along new or existing pipelines.
Background
Soil thermal conductivity plays an extremely important role in guarantying the safe and economic operation of a hot oil pipeline,1 it being the main determinant of the overall-heat-transfer coefficient of the buried hot oil pipeline. The primacy of this role influences the cooling rate and the oil temperature distribution of the pipeline in operation and the number and location of oil heating stations and heating furnaces during design.
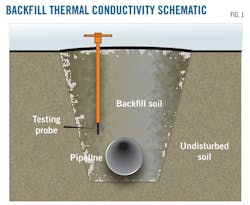
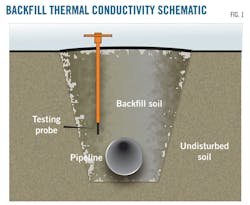
The backfill soil (Fig. 1), the undisturbed soil, and the pipeline anticorrosive layer together comprise the pipeline thermal insulation layer and influence pipeline cooling. The particle size, compactness, and water content of backfill soil in the pipeline trench may vary dramatically from the undisturbed soil during both excavation and filling. If the backfill soil is replacement soil, its composition would also change.
Several factors complicate determining the thermal conductivity of backfill soil:
• An oil pipeline could be several hundred kilometers long, crossing different types of soil and complicated terrain and requiring testing over a wide geographic area. Since soil thermal conductivity testing methods only apply to a relatively small area, accurately determining soil thermal conductivity distribution for the whole area requires densely scattering testing along the pipeline route and the accompanying large workload.2
• Thermal conductivity of soil depends on its water content, which is affected by seasonal rainfall, wind, sunlight, and temperature. Soil thermal conductivity may therefore change regularly over a year, requiring multiple rounds of testing and further expanding workload.
• Soil compactness and water content may easily change if it is excavated from the pipe ditch and transported to the testing laboratory. Field testing methods are therefore preferred, but these are also vulnerable to weather and labor constraints.
• Since the pipeline is buried underground, its anticorrosive layer can be easily destroyed by drill tools or testing probes. Therefore, the location and depth of the drill hole must be selected carefully when testing soil thermal conductivity along the pipeline.
Test principle
The line-heat source method is the most widely used thermal conductivity testing method. It has a short test cycle, high test accuracy, relatively low requirements of the test environment, and good portability of equipment, making it the perfect field test method.
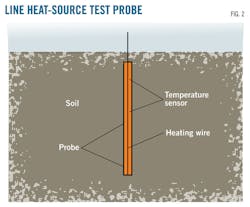
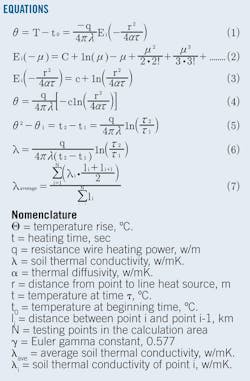
Fig. 2 shows the line-heat source method. A spindly probe consisting of a heating wire, a thermocouple, and a probe shell provides the ideal line-heat source. Probe and soil temperatures achieve steady state before testing begins. Once under way, a constant voltage is loaded on the heating wire, and the rate of heat removal between the heating wire and the surrounding soil is constant. Equation 1 illustrates temperature increases according to the line-heat source hypothesis.3
In Equation 1 Ei is an exponential integral function determined by Equation 2. And in Equation 2, the value of 'r' is small, but the value of τ is large, leading to μ = r2/4ατ being very small and Ei(-(r2/4ατ)) being described by the former two items of their series expansion, Equation 3. Substituting the time function relation yields Equation 4, with c = 0.57726 (Euler's constant). When τ = τ1, t = t1, τ = τ2, or t = t2, Equation 5 can determine the temperature of point r, leading to the final formula, Equation 6. Once q, τ1, τ2, t1, and t2 have been measured, Equation 6 can determine soil thermal conductivity.4-6
Test instrument
The thermal conductivity testing equipment used in the Niger pipeline project was the field thermal needle system for thermal resistivity (FTN01). FTN01 applies the unsteady thermal conductivity test method based on the line-heat source method.6 It can quickly test soil thermal conductivity and the temperature at the testing point.
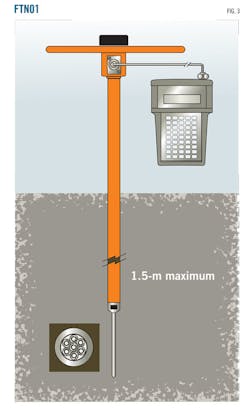
FTN01 consists of three main parts (Fig. 3):
- The unsteady state line-heat source method test probe, TP09, with a length of 170 mm and a diameter of 3.7 mm. It consists mainly of a heating wire, a heating resistance, and a protective shell (Fig. 2).
- The control lance, LN01, with a length of 1,600 mm and a diameter of 30 mm. LN01 consists primarily of a hollow metal rod, a T handle, and a data cable connecting TP09 to the control and data recording apparatus (CRU01).
- CRU01 provides power to the system, controls the temperature of the heating wire, and tests and records heating resistance.
Table 1 shows FTN01's main parameters. Its measurement range is 0.1-6.0 watts per meter kelvin (w/(mK.)), with the thermal conductivity of most soils 0.2-3 w/(mK.).4
Test procedure
The Niger buried hot oil pipeline is in western Africa and south of the Sahara desert. The pipeline is 462.5 km (about 287 miles) long, with a 12-in. OD and 0.25-in. WT. The center depth of the buried pipe is 50.7 in. There is one initial station, one terminal station, five intermediate stations, and six pipe sections. The pipeline crosses varied terrain, including tropical desert, tropical grassland, and farmland.
Testing accuracy requires selection of testing points along the pipeline according to a mean distance, with some testing points added to address special areas such as riverbeds and noticeable changes in landform. The local rainy and dry seasons guided the tests' timing, with the six rounds done in March, April, May, July, and September 2011 and February 2012. Each round staggered the testing points to improve coverage.
To ensure accuracy, the test procedure at each point followed these steps:8
• Determine test point position using the test plan and settle the positions by pipeline mileage pile and global positioning system (GPS). The test point should be on the top of the backfill soil uplift and more than 20 m from the mileage pile.
• Use a special soil auger to drill a hole and clear the soft soil at the bottom of the hole. The hole's diameter is about 150 mm and its depth about 100 cm. After insertion into the soil, the probe should remain 10 cm from the top of the pipeline.
• Record testing position, terrain, and vegetation around the testing hole. Record changes in soil characteristics at different depths during the drilling process. Pay particular attention to the influence of rain and changes in soil color and hardness. Take many photographs to record the surrounding environment.
• Keep the testing probe in the hole without touching the bottom soil for 2 min and make the probe and the air in the hole achieve preliminary thermal equilibrium. Then insert the probe into the bottom soil. After exchanging heat between the probe and the soil for about 10 min, begin testing.
• Open CRU01 and set heating voltage and testing time. When testing begins, a constant heating voltage loads on the heating wire and the heating wire transfers heat to the surrounding soil. A thermocouple measures the temperature of the probe's outer wall at the same time, with CRU01 recording the temperature and the time. Testing strictly follows procedures and the entire process lasts roughly 7 min. Avoid touching and shaking the probe during testing, so as to not affect test results.
• Manually record test results and save them in CRU01. Backfill the test hole, close CRU01, check all the equipment, and then go to the next test point to continue testing in the same way.
Results, analysis
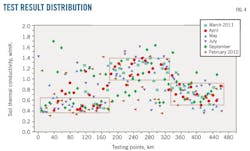
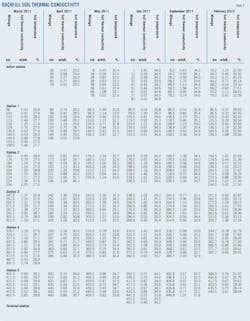
Six rounds of testing took place; one each in March, April, May, July, and September 2011, and in February 2012. Table 2 shows preliminary results and Fig. 4 the testing result distribution map of backfill soil thermal conductivity along the pipeline, which ranges from 0.3 w/(mK.) to 1.6 w/(mK.). Differences in terrain, climate, and local factors produce the following distribution characteristics of backfill soil thermal conductivity along the pipeline:
• The pipeline from 0 km to 160 km is in the tropical desert, and backfill soil thermal conductivity ranges from 0.4 w/(mK.) to 0.6 w/(mK.). The silt sand soil is very dry, and the color and water content of the soil at different depths have no obvious differences, making its thermal conductivity very small. In specific areas, the top soil is very dry, but the soil at the depth where the pipeline is buried is relatively wet due to groundwater, and the soil thermal conductivity is higher than in the rest of the area.
The tropical desert has very limited rainfall during the July-September rainy season, averaging no more than 50 mm/year. Sunshine is very intense and the water in the top soil evaporates quickly. Even small amounts of rain could affect the soil at pipeline depth, causing a rise in soil thermal conductivity. Thermal conductivity of deep soils would not be affected.
• The pipeline from 160 km to 330 km is in the tropical grassland and backfill soil thermal conductivity ranges from 1.0 w/(mK.) to 1.4 w/(m∙K). High water content creates the high soil thermal conductivity. When building during the rainy season, most of the pipe trench is rained on and is then backfilled without completely drying.9
During testing in the dry season, the soil water content at depth-of-pipe-center remains high. Soil water content shrinks and backfill soil thermal conductivity follows the same rule from March 2011 to February 2012.
• The pipeline from 330 km to 462.5 km is in grassland and farmland, and backfill soil thermal conductivity ranges from 0.5 w/(mK.) to 0.8 w/(mK.). Construction occurred in the dry season when there is rarely rainfall. Soil thermal conductivity is much lower than in the tropical grassland because of the lower water content of the soil. Soil thermal conductivity, however, is much higher than in the desert area because of the higher compactness of sandy clay.
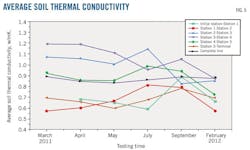
The soil thermal conductivity tested only represents a small area and is not suitable for pipeline thermal state calculation. In this article the weighted-average method calculates average thermal conductivity of soil between two adjacent heating stations (Equation 7). Table 3 and Fig. 5 show the average soil thermal conductivity calculated.
The average soil thermal conductivity of the whole pipeline ranges from 0.8 w/(mK.) to 0.9 w/(mK.) and fluctuates seasonally, falling slowly in the dry season and rising quickly in the rainy season. Average soil thermal conductivity between the initial station and Station 2 and from Station 5 to the terminal station is quite low, but also falls slowly during the dry season and rises rapidly when the rainy season begins.
Average soil thermal conductivity between Stations 2 and 5 is relatively high and shrank steadily through the whole testing period. During the construction period, especially in the rainy season, the pipe trench fills with water, and then the water together with the soil is backfilled into the trench, giving the backfill soil a very high thermal conductivity.
During the dry season water in the pipe trench evaporates continuously, contributing to the lower average soil thermal conductivity. Rain, however, offsets evaporation during the following rainy season, with soil water content and thermal conductivity both increasing slightly as a result. This cycle continues with each new season.
Niger pipeline
Because backfill soil surrounds the pipeline directly, its thermal conductivity greatly influences the temperature drop rate of the oil in the pipeline. When determining pipeline commissioning plans and daily operating plans, engineers should consider thermal conductivity distribution along with more frequently considered factors such as flow rate, temperature, and pressure.
Calculation of soil thermal conductivity's effect on the Niger pipeline's total heat-transfer coefficient, outbound temperature, and fuel oil consumption took place under the following conditions:
- Consecutive heating stations are an average distance of 80 km apart.
- OD = 323 mm.
- Crude pour point for oil produced at Goumeri is 37° C. and the allowable minimum inlet temperature is 40 °C.
Calculation also used data from September 2011, when the soil temperature at the depth of the pipeline center was 33 °C. and pipeline flow 250 cu m/hr. Average soil thermal conductivity ranged from 0.45 w/(mK.) to 1.10 w/(mK.). Soil thermal conductivity's influence on pipeline operating conditions was simulated, with results shown in Table 4.
Pipeline total heat-transfer coefficient, pipeline outbound temperature, and fuel oil consumption all rise with increased thermal conductivity. In order to guarantee temperature at the end of a pipeline section remains at 40 °C. or more, the temperature at the inlet must be 44.7-58.3 °C., with fuel oil consumption increasing to 304.8 kg/hr from 78.4 kg/hr.
References
1. Yang, X., "Pipeline Design and Management," Petroleum University Press, Beijing, May 2006, pp. 76-79.
2. Hou, F.Z., "Material Thermal Conductivity Measurement with a Probe Method," Petroleum University (Natural Science)[where?], Vol. 18 (1994), pp. 94-99.
3. Lebo, H., and Wang, K.K., "Line-Heat-Source Thermal Conductivity Measuring System," United States Patent, Patent Number: 4,861,167, 1989.
4. Lipiec, J., Usowicz, B., and Ferrero, A., "Impact of soil compaction and wetness on thermal properties of sloping vineyard soil," International Journal of Heat and Mass Transfer, Vol. 50, Issue 19-20 (September 2007), pp. 3,837–3,847.
5. Carslaw, H. S., and Jaeger, J. C., "Conduction of Heat in Soils," Oxford University Press, London, 2nd ed., pp. 58-60, 344-345, 1964.
6. Manohar, K., Yarbrough, D.W., and Booth, J.R., "Measurement of Apparent Thermal Conductivity by the Thermal Probe Method," American Society for Testing and Materials, Journal of Testing and Evaluation, Vol. 28, No. 5 (September 2000), pp. 345-351.
7. Xiao, L., and Li X.Z., "Moisture Content and Porosity of the Soil Thermal Conductivity of Laboratory Experiments," Journal of PLA University of Science and Technology (Natural Science), Phase III, pp. 241-247, June 2008.
8. IEEE Std 442-1981, "Guide for Soil Thermal Resistivity Measurements," IEEE Standards Board, reaffirmed 1996.
9. Becker, B.R., Misra, A., and Fricke, B.A., "Development of Correlations for Soil Thermal Conductivity," International Communications in Heat and Mass Transfer, Vol.19, No. 1 (January-February 1992), pp. 56-68.
The authors
Yutian Li ([email protected]) is a doctoral student at China University of Petroleum, Beijing. He has also worked as undergraduate student at University of Petroleum China, Huadong. He holds a bachelor's degree (2008) from University of Petroleum China.
Changchun Wu ([email protected]) is a professor at China University of Petroleum, Beijing. He has served as professor assistant, lecturer, and associate professor at the university since 1985. He holds a master's (1985) in oil and gas pipeline engineering from Beijing graduate school of East-China Petroleum Institute. He is a member of the Chinese Petroleum Society.
Xiaokai Xing ([email protected]) is an associate professor at China University of Petroleum, Beijing. He has served as associate professor at University of Petroleum China, Huadong. He holds a PhD (2005) from Beijing University of Technology.
Dan Dou ([email protected]) is manager of pipeline operation department at CNPC Niger Petroleum SA, Niamey. He has also served as superintendent in the pipeline department of China National Oil and Gas Exploration and Development Corp. He holds a PhD (2007) from China Petroleum University.
Yang Yu ([email protected]) is a student at China University of Petroleum, Beijing. He holds a bachelor's degree from Xi'an Petroleum University. He is a student member of the Operations Research Society of China.
