US LNG EXPORT PROJECTS—2 (Conclusion): Projected financial performance supports building at least a few

John Paisie
JEA Consulting Group
Toledo, Ohio
The projected financial performance of proposed US LNG export plants supports the building and commissioning of at least a few of them. The proposed plants, however, face large risks. Potential supply-demand shifts in both the US and destination markets could result in price shifts much greater than the 10% used in this article's sensitivity analysis.
Competitors can also act to damage the financial viability of proposed US LNG plants by, for instance, changing their pricing approach so that US exports will no longer be attractive. The success of such defensive strategies will depend in part on growth in global demand for natural gas in comparison with growth in supply outside the US.
The extent to which China and India shift from coal towards natural gas will play a large role in determining the future supply-demand balance. China depends on coal for about 70% of its energy requirements, and India on coal for more than 50% of its. In contrast, natural gas only meets about 4% of China's energy requirements and 11% of India's, according to the International Energy Agency's 2012 World Energy Outlook.
Neither country is likely to implement energy policies that will put economic growth at risk, making a shift away from coal towards natural gas likely only once an adequate supply of gas is economically available. Any major shift from coal towards natural gas therefore will be a reaction to, not a driver of, the supply-demand balance.
Proposed US LNG plants also face currency-driven risks. A major appreciation of the US dollar would damage prospects for the proposed plants, especially with respect to the other major countries in the Organization for Economic Cooperation and Development (OECD). Europe's ongoing financial crisis increases the likelihood the euro will depreciate against the US dollar. Japan would prefer the yen also depreciate against the dollar, given the structural challenges that country faces in light of an aging and shrinking population and continued dependence on exports. By contrast, however, the US dollar will likely depreciate against the major non-OECD currencies, including the Chinese yuan, as these economies continue to develop.
The first article of this two-part series (OGJ, Dec. 3, 2012, p. 116) provided a qualitative assessment of each of the proposed US LNG export plants to determine the most likely to move towards construction and commissioning. The assessment used a framework of three major dimensions: structural, financial, and timing.
The structural dimension showed the operational advantages and disadvantages associated with each plant. The financial dimension showed the level of uncertainty associated with investors' ability to raise the required funds for each. The timing dimension addressed the site or sites best positioned to benefit being one of the first to develop their project.
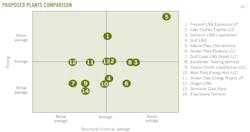
Qualitative assessment showed the Sabine Pass terminal having an advantage over the others (Fig. 1). Sites at the next level below the Sabine Pass project include Freeport LNG expansion, Cameron LNG liquefaction project, and Excelerate's floating terminal. The Golden Pass terminal scores relatively high in structural and financial terms, but lags in terms of timing.
Borderline projects (average in terms of structural, financial, and timing) include the Lake Charles export plant and Dominion's Cove Point, Md., terminal. The Gulf LNG terminal at Pascagoula, Miss., and the Main Pass energy hub, on Main Pass Block 299 in 210 ft of water off Louisiana, are average in structural and financial terms but lag in terms of timing. Remaining projects score below average structural, financial, and timing terms. These projects are least likely to be built.
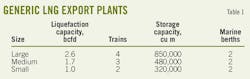
This concluding article uses a quantitative approach comparing the proposed projects to generic LNG export plants (Table 1). A financial model developed by JEA Consulting assessed the financial performance of generic LNG plants in each location: East Coast (medium and small plants), Gulf Coast (large and medium plants), and West Coast (medium and small plants).
A tolling arrangement is the likely business approach for the proposed LNG export plants, but project assessment used the economic performance of the entire value chain from the purchase of the natural gas to the delivery and sale of the LNG at its destination. Plants will only be successful if real economic value is being generated in the broader perspective. Applying this approach to financial analysis in the reference scenario and associated price forecasts developed by JEA Consulting Group shows each plant generating returns greater than 20%.
Sensitivity analysis
While results from the financial analysis support building the LNG export plants, the analysis is not definitive given the level of uncertainty. JEA therefore undertook further analysis addressing each export plant's financial robustness. This evaluation considers the importance of location (East Coast, Gulf Coast, and West Coast), and a range of additional factors affecting financial performance of generic LNG plants. Factors considered include:
• Utilization rate, based on throughput as a percentage of design capacity for each liquefaction plant.
• Operating expenses, based on typical costs of a liquefaction plant; including maintenance and administrative costs for a medium-sized plant, with adjustments for differences in scale for large and small plants.
• Shipping costs, based on the spot rates for each of the most likely routes: East Coast to Europe, Gulf Coast to Europe, Gulf Coast to Asia, and West Coast to Asia.
• US natural gas prices, based on the reference scenario developed by JEA Consulting Group with adjustments for locations: East Coast, Gulf Coast, West Coast.
• Natural gas prices at destination, with Japan as the proxy for Asia and Spain as the proxy for Europe, based on the reference scenario developed by JEA.
• Capital expenditures, based on the typical $/ton for a medium-sized plant with adjustments for economies of scale when constructing a larger (advantage) or smaller (disadvantage) plant.
• Cost of capital, based on financing arrangements and typical interest rates for project debt and return-on-equity consistent with risk associated with already active LNG-related sites.
• Exchange rates, based on 2013 outlook provided by the OECD for rates between the US dollar and Japanese yen and between the US dollar and euro, including expectations for longer-term trends.
JEA's in-house financial model of generic liquefaction plants assessed the relative impact of these factors. Using the model required adjusting the value of each factor by 10%, while keeping the value of the other factors unchanged, and then calculating the value of discounted cash flows. Comparing the calculated value to the original value of the discounted cash flows yields the output shown in Table 2.
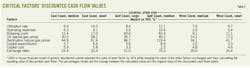
Analysis shows shipping costs, US natural gas prices, natural gas prices at the destination, and exchange rates affecting plant financial performance most. Analysis also shows that, while an advantage, lower upfront capital expenditures associated with import terminals to be converted to export plants (in comparison with greenfield sites) may not be large in the overall scope of issues surrounding the LNG export plants.
The external environment affects the financial performance of US Gulf Coast-based LNG export plants more than it affects export plants on the East Coast or West Coast, due mainly to the higher shipping costs associated with Gulf of Mexico siting. Several positive attributes, however, partially mitigate this negative factor. The proximity to liquid natural gas markets allows access to supply at the most favorable prices, while the ability to transport LNG to either Europe or Asia provides for additional arbitrage opportunities.
The economies of scale associated with larger facilities help offset higher shipping costs. Expansion of the Panama Canal to allow LNG tankers could also help this situation (OGJ, Mar. 15, 2010, p. 39). If, however, fees associated with the Panama Canal are set on the basis of alternative routes, shipping costs will be only marginally less than the costs associated with current routes.
Risk assessment
The sensitivity analysis identified the factors having the greatest effect on the proposed LNG export plants' financial performance. Each of these factors can move in directions that will have either a positive or negative impact on a given project.
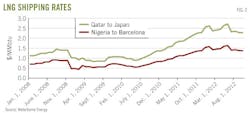
• Shipping costs. The cost of shipping LNG has increased in nominal terms for the last 2 years after decreasing in the aftermath of the economic downturn (Fig. 2). Further increases in shipping costs could occur with growing LNG shipments and misalignment in the timing of the fleet additions.
• US natural gas prices. Natural gas prices in the US have fallen from their 2008 highs (Fig. 3). This article's reference scenario forecasts an upward trend in the nominal price of natural gas over the next 20 years.
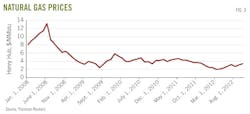
The forecast assumes that US natural gas production will increase in a timely manner to meet domestic needs and allow LNG exports without resulting in a major hike in domestic prices. The forecast also assumes the cost structure associated with shale gas producers will stay structurally the same. The reference scenario will not hold if supply growth is not sustainable, either because of environmental constraints or a step change in shale gas producers' cost structure.
Natural gas prices will rise if the government places stricter regulations on coal-fired power plants, leading to a greater-than-anticipated shift from coal to natural gas in the power sector. Declining oil prices could tighten US natural gas supply, given the influence of NGL prices on the financial performance of the shale gas operators. Relatively high oil prices also create the potential for greater use of natural gas in the transportation sector, which would put downward pressure on oil prices while putting upward pressure on natural gas prices.
Structural characteristics of the US natural gas market could also affect US natural gas prices. US weather conditions add seasonal volatility to the large US demand, creating potential spikes in the price of natural gas. This dynamic is unique to the US; other major natural gas exporting countries have either a smaller domestic market, less varied seasons, or both. US LNG exporters could mitigate some of this risk by hedging but would still remain open to both negative financial and public relations exposure in the event of a sharp rise in prices.
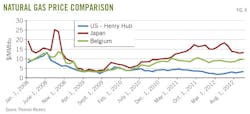
• Destination pricing. The differential between US natural gas prices and natural gas prices in Europe and Asia has often been substantial over the past few years. This article's reference scenario assumes the differential will narrow but remain sufficient to support US exports.
There are, however, several developments that could cause the differential to narrow to the point that US exports are no longer possible, including expansion of alternate sources of natural gas supplies. The Australian Gorgon LNG project is scheduled for 2015 commissioning. LNG exports are also proposed from plants on Canada's West Coast.
Additional competition will come from pipelines moving natural gas from the former Soviet Union (FSU) and Caspian region to Asia. Shale gas development in Asia (including China, Australia, and India) could also affect natural gas prices in the region. Shale gas development in China is still in its infancy but could ramp up quickly by building on lessons learned in the US.
Natural gas prices in Europe could likewise narrow their differential more than the reference scenario reflects, as the relationship between oil prices and natural gas prices weakens with increased competition. Increased competition has already lowered natural gas prices in Europe relative to Asia. Further decoupling could take place as current suppliers of natural gas to Europe adjust their pricing approach as part of a defensive strategy to decrease the attractiveness of building US export terminals.
Exchange rates
The US dollar has depreciated substantially against other major currencies (including the Japanese yen, the euro and the British pound), starting in 2002 (Fig. 5).
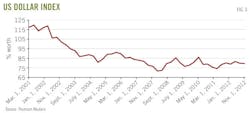
Depreciation of the US dollar has made natural gas priced in local currencies cheaper in Asia and Europe, supporting higher prices in dollar terms. An appreciation in the US dollar would, conversely, result in lower natural gas prices when converting the local price into a US dollar-based price.
A stronger dollar would also tend toward lower oil prices, given the inverse correlation between the currency and dollar-denominated commodities. Lower oil prices would, in turn, depress natural gas prices, with the biggest impact felt in Asia and Europe, where gas prices remain linked to oil prices.