Work flow shown to develop useful seismic velocity models
Khalid Amin Khan
Oil & Gas Development Co. Ltd.
Islamabad
Gulraiz Akhter
Quaid-i-Azam University
Islamabad
Velocity is a fundamental property of rocks that depends on density and elastic moduli.
It varies laterally as well as vertically due to the physical-geologic variations of rocks.
Velocities are determined less precisely from closely spaced seismic reflection data, while precise measurements are obtained from widely spaced boreholes. Velocities appear to be complex due to their various types and usage in processing and interpretation applications.
This article presents a work flow to develop useful velocity models that can be used in various stages of processing, interpretation, and rock physics analysis.
Introduction
The seismic method is governed by velocities, which in turn depend on density and elastic moduli of rocks.
Velocity is a complex parameter, as it exists in a number of types and varies laterally as well as vertically due to the changing physical and geologic conditions. Velocities are generally required for dynamic corrections, migration, time to depth conversion, and more precisely for rock physics analysis to determine porosity and identify fluid type and its saturation.
Most of the velocity information is derived indirectly from surface based seismic data by using velocity analysis involving stacking velocities obtained from common depth point (CDP) stacks. Some common velocity analysis techniques are constant velocity stack (CVS), constant velocity gathers, and semblance based velocity spectrum displays.1
On the other hand, velocities are measured directly and more precisely by using borehole techniques such as sonic logs, check shots, and vertical seismic profiling.2
Although seismic is the main source of velocity distribution information for the whole survey area, borehole velocities at widely dispersed well points provide reliable correlation and control for calibrating the seismic velocities.
In this article a work flow is presented for management, storage, processing, analysis, and visualization of velocity data to create useful velocity distribution models.
Relationships between velocity types
Before we proceed with processing and analysis of velocity data, it is important to understand the difference between various types of velocity.
Some common types of velocities are stacking, normal-moveout (NMO), root-mean-square (rms), average, interval, and instantaneous. For a single horizontal, homogeneous and isotropic layer all the above mentioned velocities are same, but such ideal layers do not exist in nature.
The velocities derived from seismic data are stacking velocities. These are also commonly referred to as NMO and rms velocities. However, stacking and NMO velocities differ on the basis of spread length. The stacking velocity is basically a parameter that generates the best stack. It is based on the travel time hyperbola that best fits data over the entire spread length, while NMO velocity is based on the small-spread hyperbolic travel time.
The stacking velocity is a good approximation to the rms velocity, which implies a path normal to a sequence of parallel layers. However, stacking velocities differ substantially from the rms velocities in areas with large lateral variations in velocity.3
The rms velocity has no physical relevance as it cannot be used in time to depth conversion, however it provides a link between nonphysical stacking velocity and physical measurements of velocity, such as average, interval, and instantaneous velocities.
These three types of velocity can be measured in the earth by borehole techniques, and the difference between them is that of scale. The interval velocity is the average velocity of an interval or layer, the instantaneous velocity is the interval velocity of a small interval such as sampling rate, while the average velocity is the interval velocity of an interval that begins at the surface.
The average velocity can be considered as the vertically stacked average of all layers within a given depth. The interval velocity can be computed from rms velocity using Dix4 equation. Interval velocities can also be directly derived from seismic data using special velocity analysis techniques.5
Al-Chalabi6 has also discussed relationships and formulations between various types of velocities. Software tools are available that can easily convert the seismic derived rms velocities into interval and average velocities.
Seismic velocity calibration
Seismic is an indirect source of velocity information, thus seismic velocities need to be refined through calibration using more precisely measured borehole velocities.
This calibration requires both seismic and borehole velocities to be in the same form in terms of resolution or sampling interval, type of velocity, and time-depth domain. Discrepancy also exists between borehole velocities from VSP and sonic logs7 that must be resolved before calibration.
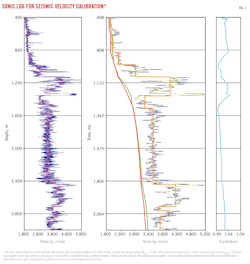
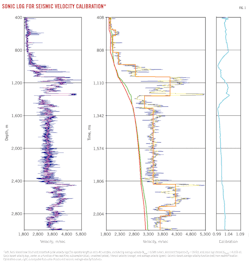
Fig. 1 shows stepwise transformation of a sonic based velocity log into an average velocity function for comparison with the nearest seismic velocity function to generate a calibration curve.
The resolution of the sonic log is about 61 cm or even less, and that of the seismic is 10 m at shallow depths and around 50 m at greater depths. Thus the seismic resolution is approximately 1⁄100 that of the sonic log.8 The velocity functions instead have coarse samples of velocity-time pairs picked at prominent reflectors during velocity analysis.
The sonic based velocity log resolution is reduced by applying a large length moving average operator. The operator length is computed by considering the seismic resolution and sonic log interval. The average wavelength of seismic data is given by Equation 1, where Vave is average velocity and fd is dominant frequency, and the seismic resolution is given by Equation 2.
The operator length is set to 1⁄10 of seismic resolution and is given by Equation 3, where ISonic is sonic log interval. As the operator length must be an odd number, the resulting value is set to the closest odd value. The smooth velocity log is then subsampled at 1⁄4 the operator length. The subsampled velocity log is further smoothed by applying an 11 point moving average operator.
Integrated travel time (TTI), which is the mean travel time in milliseconds, is derived from the sonic interval transit time Δt. This time is doubled to convert the log from depth domain into two-way time (TWT) domain for comparison with seismic velocity functions.
Horizon times are available in the closest seismic velocity function as velocity-time pairs, which are used to compute interval velocity function from the velocity log. Finally an average velocity function is computed from the interval velocity function.
On the other hand the closest seismic rms velocity function is also converted into an average velocity function. Both the sonic and seismic average velocity functions are matched, and a calibration curve is generated.
Each sample of this curve is computed using Equation 4, where VSonic and VSeis are the sonic and seismic average velocity samples respectively, at a given time. This curve is multiplied with all seismic based average velocity functions in the area to calibrate them with respect to the sonic log velocity.
It must be noted that usually the seismic velocities are decreased or increased by a fixed percentage through multiplication with a constant correction factor. The calibration curve on the other hand represents a time variant correction factor.
If multiple wells with sonic logs are available in the area then calibration curve for each well is computed through comparison with its nearest seismic velocity function. These calibration curves are then interpolated at all common depth point (CDP) locations with seismic velocity functions, using geostatistical techniques applied in standard gridding procedures. In this way the calibration is not fixed but varies laterally as well as vertically.
λ = Vave ÷ fd (1)
R = λ ÷ 4 = Vave ÷ 4fd (2)
N = 0.1 (R ÷ ISonic) (3)
C = VSonic ÷ VSeis (4)
Velocity processing work flow
Velocity is an important parameter and must be maintained and managed through a georeferenced database system.
Khan et al.9 presented an architecture that includes a velocity database along with an array of other geoscientific databases. Velocity information is used in a number of processing, interpretation, and rock physics applications.
To allow interoperability of velocity data between various applications, a class of velocity data formatting programs for all major software vendors has been developed in Output Input Language (OIL).10
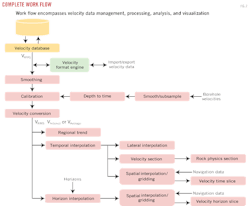
Fig. 2 shows a complete work flow for velocity data management, processing, analysis, and visualization. The database stores rms velocity functions derived from seismic data at selected CDP locations along seismic lines. This database maintains velocity data at a regional level.
The data can be imported and exported to all major seismic applications through the format engine. Velocity functions for a selected group of seismic lines or a geographic area of interest can be extracted from the database.
If required, the velocity data are smoothed by applying a moving average operator over the velocity functions. These seismic velocities can then be calibrated using more precise borehole velocities following the procedure discussed in the previous section. The calibrated velocity functions can be converted into rms, interval, or average velocities. A number of processing options are available that can be applied to these final velocity functions.
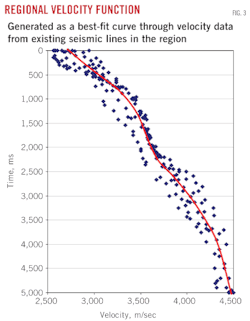
A best fit regional velocity function can be generated by applying least squares regression to velocity data from a group of existing seismic lines in an area (Fig. 3). This regional function can be used in dynamic corrections to get raw stacks for new seismic lines in the area.
Vertical and horizontal interpolation schemes are available to create velocity models in the form of 3D volume and 2D sections along various planes. Vertical temporal interpolation can be applied with a fixed sampling rate such as 200 ms.
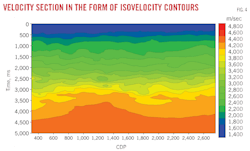
After temporal interpolation the velocity functions at velocity analysis CDP locations of a seismic line can be laterally interpolated to get a velocity function for each CDP of the line. These resulting velocity functions can be used in modeling and inversion applications. Similarly the temporal interpolated functions can be used to generate a velocity section in the form of isovelocity contours (Fig. 4).
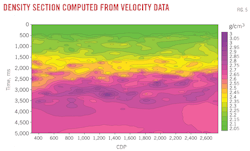
Using Castagna et al.11 12 empirical relations and rock physics equations,13 the velocity section can be converted into shear velocity, density, bulk modulus, shear modulus, Young's modulus, Poisson's ratio, and porosity sections. Fig. 5 shows a density section computed from velocity data. Such sections are useful to understand the variation of these parameters in terms of reservoir characteristics.
Finally, spatial interpolation using geostatistical gridding techniques can also be applied to the temporal interpolated velocity data to generate a 3D velocity volume. From this volume velocity time slices can be extracted in the form of color maps or contours. In seismic attributes analysis a horizon slice is preferred over a time slice. Similarly a velocity horizon slice is considered more useful.
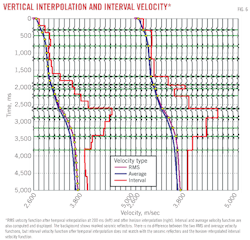
Fig. 6 shows two versions of the same velocity function, one after temporal interpolation sampled at a fixed interval of 200 ms and the other after horizon interpolation with samples at horizon times. It can be observed that there is no difference in the rms and average velocity functions, but the interval velocity functions do not match.
The interval velocity function computed from the temporal interpolated data also does not match with the seismic reflectors. Thus horizon interpolation is considered more appropriate in certain applications.
From Fig. 2 it can be seen that horizon interpolation can also be applied to velocity functions, which requires input of horizon times from interpreted seismic sections. Again spatial interpolation involving geostatistical gridding techniques can be applied to horizon interpolated velocity data to generate velocity surfaces or horizon slices. A horizon velocity slice is an important attribute that shows spatial variation of velocity along the reflector.
Another interesting application of spatial interpolation is that it can be used to interpolate velocity functions at selected CDP locations of a new seismic line, from velocity functions of existing seismic lines as shown in Fig. 7. These functions can be used in dynamic corrections instead of a regional velocity function which does not incorporate lateral velocity variations. The resulting raw stack will therefore have the quality of a Brute stack. Thus a velocity database can be used to interpolate velocity functions for new seismic lines.
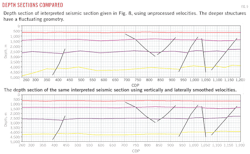
It has been observed that usually time to depth conversion is applied to only the horizon of interest, resulting in a depth contour map. This does not highlight any velocity related problems. It is highly recommended that velocity functions must be overlaid on the interpreted seismic section for visual correlation (Fig. 8), and depth sections must be generated (Fig. 9). If there is any problem in the velocity data, the depth section will show an erratic geometry. Thus the velocities must be refined and smoothed to get the correct geometry of subsurface structures.
Summary
A work flow is presented that includes a database for storage of velocity data at regional level, a formatting engine for interoperability of velocity data with all major seismic application, and a set of processing, analysis, and visualization tools for effective use of velocity data.
It has been demonstrated through this work flow that:
• Horizon interpolation is preferred over temporal interpolation in certain applications.
• Spatial interpolation can be applied to velocity data from the database to generated velocity functions for a new seismic line in an area.
• Velocities must be overlaid on interpreted seismic sections before time to depth conversion and if required velocity data must be refinement and smoothed.
These procedures will help in delineating the true and reliable geometry of subsurface structures.
References
1. Taner, M.T., and Koehler, F., "Velocity Spectra—Digital Computer Derivation Applications of Velocity Functions," Geophysics, Vol. 34, 1969, pp. 859-81.
2. Yilmaz, O., "Seismic Data Analysis—Processing, Inversion and Interpretation of Seismic Data," Vol. 2, 2nd Edition, Society of Exploration Geophysicists, Tulsa, 2001, p. 1,907.
3. Lynn, W.S., and Claerbout, J.F., "Velocity estimation in laterally varying media," Geophysics, Vol. 47, 1982, pp. 884-97.
4. Dix, C.H., "Seismic Velocities for Surface Measurements," Geophysics, Vol. 20, 1955, pp. 68-86.
5. Schultz, P.S., "A method for direct estimation of interval velocities," Geophysics, Vol. 47, 1982, pp. 1,657-71.
6. Al-Chalabi, M., "An Analysis of Stacking, RMS, Average, and Interval Velocities over a Horizontally Layered Ground," Geophysical Prospecting, Vol. 22, 1974, pp. 458-75.
7. Stewart, R.R., Huddleston, P.D., and Kan, A.T.K., "Seismic versus sonic velocities: A vertical seismic profiling study," Geophysics, Vol. 49, 1984, pp. 1,153-68.
8. Sheriff, R.E., "Seismic Stratigraphy," Int. Human Resources Dev. Corp., Boston, 1980.
9. Khan, K.A., Akhter, G., and Ahmad, Z., "The Real meaning of Geoscience Data and Process Integration," Proceedings of IAMG International Conference, Computational Methods for Earth, Energy and Environmental Sciences, Stanford Univ., Calif., 2009.
10. Khan, K.A., Akhter, G., and Ahmad, Z., "OIL—Output Input Language for Data Connectivity between Geoscientific Software Applications," Computers & Geosciences, Vol. 36, 2010, pp. 687-97.
11. Castagna, J.P., Batzle, M.L., and Eastwood, R.L., "Relationships between compressional-wave and shear-wave velocities in clastic silicate rocks," Geophysics, Vol. 50, 1985, pp. 571-81.
12. Castagna, J.P., Batzle, M.L., and Kan, T.K., "Rock Physics—The link between rock properties and AVO response, in Offset-Dependent Reflectivity—Theory and Practice of AVO Analysis," J.P. Castagna and M. Backus, eds., "Investigations in Geophysics," No. 8, Society of Exploration Geophysicists, Tulsa, 1993, pp. 135-71.
13. Mavko, G., Mukerji, T., and Dvorkin, J., "The Rock Physics Handbook—Tools for Seismic Analysis in Porous Media," Cambridge University Press, Cambridge, 2003, pp. 17-53.
The authors
Khalid Amin Khan ([email protected]) is a research geophysicist and instructor at the Oil & Gas Training Institute of Oil & Gas Development Co. Ltd. He has 18 years of experience in geophysical software development, seismic data processing, and systems management. He has also worked for some time with CGG as a geophysical systems engineer. In 1998, he founded K-tron Research, a geophysical software company, where he has been involved in the development of various geoscientific applications. He holds an MSc from Quaid-i-Azam University, where he is a visiting faculty member.
M. Gulraiz Akhter ([email protected]) is an assistant professor in the Department of Earth Sciences at Quaid-i-Azam University. His areas of interest are exploration geophysics and numerical groundwater modeling. During his 20 years of experience, he has taught mathematics, geophysics techniques, and hydrogeology. He has an MS in geophysics and a PhD in hydrogeology from Quaid-i-Azam University.
More Oil & Gas Journal Current Issue Articles
More Oil & Gas Journal Archives Issue Articles
View Oil and Gas Articles on PennEnergy.com
