Well production profiles assess Fayetteville shale gas potential

James E. Mason
Hydrogen Research Institute
Farmingdale, NY
Well production profiles for the Fayetteville shale gas play in north-central Arkansas provide estimates of potential ultimate gas recovery from the play.
The four well production profiles constructed were:
1. Peak month production rates for the first year.
2. Total first-year well production rates.
3. First-year well production decline rates.
4. Inter-annual well production decline rates for the first 4 years.
With these profiles, the next step in evaluating the play was construction of an average well to estimate ultimate gas recovery for a 40-year well production life. The average-well profile then was used to project the scale of well development required to maintain an annual shale gas production level of 500 bcf for 40 years, a useful value because the 500 bcf/year can be scaled to any annual shale gas production.
Fayetteville shale gas
Fayetteville is one of earliest shale gas plays developed with horizontal drilling. The play covers 9,000 sq miles and has technically recoverable gas resources of 41-58 tcf.1 2
For practical purposes, development of the play began in 2005 with the introduction of horizontal drilling. From 2005 to the present, the play has seen an impressive growth in gas production (Fig. 1).

The Fayetteville play produced 520 bcf of gas in 2009 and is on pace through the first 9 months of 2010 to produce 750 bcf/year.
In 2009, Fayetteville was second in shale gas production to the Barnett, which produced 1.75 tcf.3 The gas produced in these two plays accounts for about 10% of US gas production.
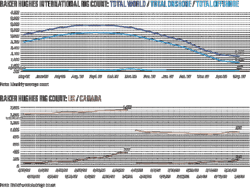
The growth in gas production is a direct result of the large number of new wells brought into production each year (Fig. 2). Based on the pace of the new wells completed during the first 9 months of 2010, new wells completed in 2010 should exceed the number completed in 2009.
Well production profiles
The data for constructing the well profiles came from the Arkansas Oil and Gas Commission's database.4 The database contains monthly gas sales volumes for 2,840 wells brought into production through September 2010. The evaluation assumed that well sales volume is the same as well production volume.
To ensure that all wells analyzed have at least 1 complete year of production, the evaluation included only wells with an initial production entry no later than October 2009. This resulted in excluding 36 wells from the analysis.
In the interest of analyzing horizontal wells, the evaluation excluded wells brought into production before October 2005 because it was assumed that the mix of these older wells is weighted toward vertical wells.
With these data constraints, the well production profiles included the following number of wells with complete annual data:
• 1,933 wells with 1 year of production.
• 1,033 wells with 2 years of production.
• 836 wells with 3 years of production.
• 69 wells with 4 years of production.
While gas production rates for individual wells are heterogeneous, which is seen in Fig. 3 for five wells, there are similarities. The 4-year well production histories show a peak in gas production in the first couple of months with a steep production decline in the following months. Also, notice that well production decline rates begin to stabilize at a relatively low level in the fourth year.
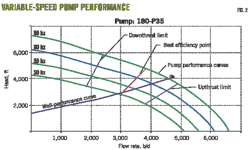
A substantial number of wells reported multiple months of zero production, which primarily is caused by shut-in periods for developing nearby wells and subsequent reservoir repressuring. Temporary pipeline constraints also may have caused some zero production months.
In Fig. 3, observe that marked improvements in well performance sometimes follows months with low or zero production. This is attributed to hydraulic fracturing of an offset well.
Peak-month production in the first year of well operation is a commonly reported measure to assess well quality.
The average well's peak-month production was 1.85 MMcfd. During the 4-year observation period, the average peak-month's production increased to 2.2 from 1.35 MMscfd. Fig. 4 presents the distribution of wells by peak-month production. Sixty-one percent of wells have a peak-month production of less than 2.0 MMscfd.
The average gas production for the first year of well operation is an important measure because horizontal shale gas wells produce about 25% of their expected ultimate recovery in the first year. The average first-year production was 1.12 MMcfd, which is equivalent to 410 MMcf/year.
Fig. 5 shows the distribution of average first-year well production rates. Note that the average first-year well production rate increased 121% from the 2005-06 production year to the 2009-10 production year, indicating learning curve gains in field exploration and drilling.
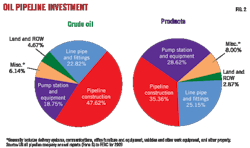
The first-year well production averages included many wells that one may consider dry or noneconomic. Fig. 6 shows the percentage of wells by first-year production totals. If it is assumed that an economic well has a minimum first-year production of 200-250 MMcf, then 20-30% of the wells completed in the Fayetteville play are uneconomic.
Based on the first year of well production, however, production rates have increased dramatically during the past couple of years. One, therefore, should expect that the percentage of uneconomic wells will decline over time.
A caveat to this is the possibility that the increase in well production rates is due to the identification and focus on core production areas. If so, the question then becomes once companies exhaust developing the core areas will the trend in Fig. 6 continue in the long-term?
Fig. 7 shows the distribution of the average well's production decline rate in the first year of production. The evaluation based the decline rate on the decrease from peak-month's production to the 12th month's production. The average first-year well production decline rate was 56%, with 50% of the well decline rates greater than the average.
The distribution of average first-year well production decline rates ranged from 53%/year to 60%/year during the 4-year observation period. This implies a relatively stable average well decline rate. Also worth noting is that the average first-year well production decline rate of 56% for the Fayetteville play is comparable with first-year decline rates reported for the Barnett play.5
The final well production profile was for the average inter-annual well production decline rates. The evaluation based inter-annual decline rates on the decline in average well production rates/year that occur from one year to the next. The average inter-annual well production decline rates are 55% from Year 1 to Year 2, 41% from Year 2 to Year 3, and 28% from Year 3 to Year 4.
With these average inter-annual well production decline rates, one would expect the average first-year well production rate of 1.12 MMscfd to decline to 0.51 MMscfd in the second year, 0.30 MMscfd in the third year, and 0.21 MMscfd in the fourth year.
Of note is that the inter-annual decline rate is not the same as the intra-annual well production decline rate, which is based on the well production decline that occurs from the peak month in a given year to the 12th month.
Average well profile
The evaluation included a model of an average well with a 40-year production history, based on the average well production profiles, as discussed previously.
Because of the brief history of horizontal shale gas drilling, well production decline rates for Years 5-40 are unknown. The evaluation assumed that the average long-term inter-annual production decline rates were 14% for Year 5, 10% for Years 6-8, 8% for Year 9, and 6% for Years 10-40.
The evaluation derived the long-term inter-annual decline rate projections from the assignment of a constant 0.83%/month well production decline rate for each month in Years 5-40. The resulting 6% terminal inter-annual decline rate is consistent with expectations stated by a representative of Southwestern Energy Co., one of the main companies developing the Fayetteville play.
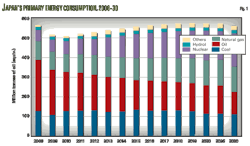
The evaluation determined that the 40-year estimated ultimate recovery (EUR) for the average well was 1.7 bcf (Fig. 8), with well production rates of:
• 805 Mcfd in the 12th month of the first year.
• 112 Mcfd at the end of the 10th year.
• 60 Mcfd at the end of the 12th year.
• 33 Mcfd at the end of the 13th year.
• 8 Mcfd at the end of the 14th year.
The average well produced about 25% of its EUR in the first year, 50% in the fifth year, and 66% in the 10th year. After 20 years, cumulative gas produced was 1.4 bcf or 85% of the well's EUR. It is interesting that an additional 20 years of production, Years 21-40, contributed only 15% to a well's 40-year EUR.
The final part of the evaluation applied the 40-year average well production profile to a projection of well development required to maintain a constant 500 bcf/year gas production. This is important because of the annual decline rates for shale gas wells. This analysis provides an approximate measure to assess the scale of drilling activity/year required to sustain a constant level of shale gas production over time.
Fig. 9 shows the annual and cumulative number of average wells required to maintain a 500 bcf/year gas-production rate. In the first year, 1,220 wells are needed to produce 500 bcf. Year 2 requires 670 new wells to compensate for declines in existing well production, and the number of wells/year required declines to 285 new wells in Years 18-40.
The number of wells to maintain a 500 bcf/year gas production rate for 40 years is 14,549.
A caveat on the usefulness of the average well concept is the effect of refracing on long-term well decline rates. Halliburton Inc. estimates that refracing will increase a well's ultimate recovery by 11-18%.5
Another complicating factor in drawing an average well picture is the effect of downspacing or infill drilling on the ultimate recovery of individual wells. Downspacing decreases well spacing to 10-40 acres/well from the current practice of 80-160 acres/well, thus increasing gas recovery from an area but at the expense of reducing ultimate recovery of individual wells within the area.
References
1. North American Natural Gas Assessment, report prepared by Navigant Consulting for American Clean Skies Foundation, July 4, 2008.
2. Availability, Economics, and Production Potential of North American Unconventional Natural Gas Supplies, report prepared by ICF International for the Instate Natural Gas Association of America Foundation (IGNAA), November 2008.
3. Barnett shale gas production, Texas Railroad Commission, Austin, 2010.
4. Fayetteville Shale Gas Sales, Individual Well Gas Sales —Cumulative Total by Monthly. Arkansas Oil and Gas Commission, Little Rock, Ark.
5. US Shale Gas—An Unconventional Resource, Unconventional Challenge. Halliburton white paper, 2008.
The author

More Oil & Gas Journal Current Issue Articles
More Oil & Gas Journal Archives Issue Articles
View Oil and Gas Articles on PennEnergy.com