OGJ FOCUS: US OLEFINS—FIRST-HALF 2010: Ethylene
Ethylene producers will long remember, some fondly and others with regret, first and second quarters 2010 as a period of unusual price volatility and unexpectedly strong profitability.
Similarly, propylene buyers and sellers will also long remember first-half 2010 as a period of extreme swings in spot for refinery-grade propylene and contract prices for polymer-grade propylene.
During the first half of this year, the industry experienced a series of operating problems and plant turnarounds. These were the immediate factors that sparked the unusual price volatility for ethylene and polymer-grade propylene and the surge in olefin-plant profit margins.
The ethylene industry, however, also continued to increase its use of ethane. The continued shift from heavy feeds to ethane provided the underlying basis for the strength in profit margins and for price volatility in the polymer-grade propylene market. We note, in 2004 and 2005, naphtha and gas oil feeds accounted for 30% of fresh feed. In first-half 2010, heavy feeds accounted for only 19% of fresh feed.
The use of heavy feeds was 200,000 b/d lower during first-half 2010 than during 2004 and 2005. The ongoing shift from heavy feeds to ethane was the primary factor that reduced coproduct propylene supply.
Feed slate trends
Petral's monthly survey results showed ethylene industry demand for fresh feed averaged 1.57 million b/d in first-quarter 2010 but declined to 1.51 million b/d in second-quarter 2010. Ethylene demand for fresh feed in first-quarter 2010 was 266,000 b/d higher (about 20%) than in first-quarter 2009 and 41,000 b/d higher than in fourth-quarter 2009.
In second-quarter 2010, demand for fresh feed equaled demand in second-quarter 2009. Despite the year-to-year increase, demand for fresh feed remained 105,000 b/d (6.4%) lower than prerecession levels of first-half 2008.
Petral's survey results showed demand for LPG feeds (ethane, propane, and normal butane) averaged 1.17 million b/d in first-quarter 2010 and increased to 1.21 million b/d in second-quarter 2010.
Demand for LPG feed in first-quarter 2010 was 224,000 b/d (24%) higher than in first-quarter 2009. LPG feeds accounted for 74% of total fresh feed in first-quarter 2010 and 80% in second-quarter 2010. For 2005-07, LPG feeds accounted for 70% total fresh feed.
As has been true since fourth-quarter 2007, most ethylene producers continued to respond to strong economic incentives to maximize the use of ethane. Furthermore, since fourth-quarter 2007, ethane availability has been sufficient to support the steady increases in demand. Ethane's share of total fresh feed averaged 56% during first-half 2010.
Two factors supported ethane's share of industry feed. First, operating rates for LPG crackers averaged 90-95% of capacity during first-half 2010. In contrast, operating rates for multifeed crackers averaged only 86% during first-half 2010. Second, in response to very favorable cost advantages compared with naphtha, ethane accounted for about 40% of fresh feed to multifeed crackers during first-quarter 2010 and 44% during second-quarter 2010.
Table 1 shows trends in olefin-plant fresh feed.
Under the view that petrochemical demand in North America will continue its gradual recovery during second-half 2010, Petral forecasts are based on an average operating rate of 86-88%. Demand for fresh feed is expected to average 1.55-1.60 million b/d during third and fourth quarters 2010. Demand for LPG feeds will average 1.19-1.21 million b/d during first and second quarters 2010 and ethane will account for 56-58% of industry feed.
Fig. 1 shows historic trends in ethylene feed.
US ethylene production
Petral survey results show that ethylene production from olefin plants totaled 12.6 billion lb in first-quarter 2010 and increased to 12.8 billion lb in second-quarter 2010. Ethylene production from steam crackers in first-quarter 2010 was 2.1 billion lb higher than in first-quarter 2010 but was 71 million lb less than in fourth-quarter 2009. Production in second-quarter 2010 was 508 million lb higher than in second-quarter 2009 but was only 200 million lb higher than in first-quarter 2010.
Production from LPG plants totaled 4.67 billion lb in first-quarter 2010 and 4.5 billion lb in second-quarter 2010. Due to operating problems and turnarounds, production from LPG crackers in first-quarter 2010 was 226 million lb less than during fourth-quarter 2009. Operating problems and turnaround activity carried over into second-quarter 2010.
Ethylene production from multifeed crackers totaled 7.98 billion lb in first-quarter 2010 and increased to 8.20 billion lb in second-quarter 2010. Production from multifeed crackers during first-quarter 2010 was 155 million lb more than during fourth-quarter 2009. Production in second-quarter 2010 increased by 270 million lb.
Table 2 presents trends in ethylene production. Petral's short-term outlook is based on the expectation that LPG crackers will rebound to operating rates of 93-95% capacity during third and fourth quarters 2010. The balance of production, 16.7 billion lb, will come from multifeed crackers. Fig. 2 shows trends in ethylene production.
US propylene production
As ethane's share of industry feed continued to grow, coproduct propylene supply from steam crackers lagged the general rebound in industry operating rates until first-quarter 2010. Petral estimates coproduct propylene supply totaled 2.40 billion lb in first-quarter 2010 and was 231 million lb (10.6%) higher than in fourth-quarter 2009. The rebound in coproduct propylene supply in first-quarter 2010 did not carry over. Production declined by 256 million lb in second quarter 2010 and totaled 2.15 billion lb.
Propylene production from LPG feeds totaled 1.01 billion lb in first-quarter 2010 and increased to 1.16 billion lb in second-quarter 2010. Production from LPG feeds in first-quarter 2010 was about 44 million lb less than in fourth-quarter 2009 but was 231 million lb higher than in first-quarter 2009.
Propylene production from heavy feeds totaled 1.39 billion lb in first-quarter 2010 but fell sharply in second-quarter 2010 and totaled only 1.06 billion lb. Production from heavy feeds in first-quarter 2010 was 274 million lb higher than in the fourth-quarter 2009. Production in second-quarter 2010 was 328 million lb, less than in first-quarter 2010 and 52 million lb less than in second-quarter 2009.
Table 3 summarizes trends in coproduct propylene supply.
Refinery supply
Refinery propylene sales into the merchant market are a function of fluid-catalytic-cracking-unit feed rates, FCCU operating severity, and economic incentives to sell propylene rather than use it as alkylate feed. Normally, FCCU feed rates increase to their seasonal peaks during second and third quarters. Furthermore, refineries typically operate FCCUs at high severity during second and third quarters. Propylene yields from FCCUs are higher when FCCUs operate at high severity.
| Beginning in January 2010, a few refining companies with plants in the Texas Gulf Coast, South Louisiana, and the Upper Midwest changed how they reported the components for mixed composition propane-propylene streams to the US Energy Information Administration. These changes affected the reported volume of propylene supply from refineries and the net availability to the merchant market. Based on preliminary discussions with EIA personnel, these refineries now report their propane-propylene streams to EIA as 100% propylene. Previously, these companies reported mixed composition streams to EIA as 100% propane. This topic will be the subject of extensive discussion and debate by the NGL Market Information Committee of the Gas Processors Association and between the committee and the EIA. Furthermore, this issue highlights the inherent uncertainty of the reported statistics of refinery-propylene supply. |
Statistics from the US Energy Information Administration indicate FCCU operating rates followed the typical seasonal trend during fourth-quarter 2009 and first-quarter 2010. EIA reported FCCU feed declined by 330,000 b/d in fourth-quarter 2009 and averaged 4.85 million b/d. FCCU feed was also 56,000 b/d lower than in fourth-quarter 2008. FCCU feed averaged 34.7% of refinery crude runs in fourth-quarter 2009, however, or 6.7% higher than in fourth-quarter 2008.
According to EIA statistics, FCCU operating rates declined further in first-quarter 2010, averaging 4.6 million b/d. Feed was 85,000 b/d lower than in first-quarter 2009. FCCU feed averaged 33% of crude runs in first-quarter 2010. The ratio compared with crude runs was the same in first-quarter 2009.
Refinery-grade propylene production totaled 3.7 billion lb in fourth-quarter 2009 and averaged 40.2 million lb/day. Consistent with the seasonal decline in FCCU feed rates, merchant sales from refineries were 96 million lb less than in third-quarter 2009. Refinery-grade propylene sales, however, were 387 million lb more than in fourth-quarter 2008.
The problem with reporting changes of propane/propylene by some refining companies became immediately apparent with EIA statistics for January 2010 and for the full first-quarter 2010. Although FCCU feed rates in first-quarter 2010 were 245,000 b/d less than in fourth-quarter 2009, EIA statistics showed refinery propylene sales increased to 4.73 billion lb, or 27.9% more than in fourth-quarter 2009.
| Feedstock prices, coproduct values, and ethylene plant yields determine ethylene production costs. Petral maintains direct contact with the olefin industry and tracks historic trends in spot prices for ethylene and propylene. We use a variety of sources to track trends in feedstock prices. Some ethylene plants have the necessary process units to convert all coproducts to purity streams. Some ethylene plants, however, do not have the capability to upgrade mixed or crude streams of various coproducts and sell some or all their coproducts at discounted prices. Petral evaluates ethylene production costs in this article based on all coproducts valued at spot prices. |
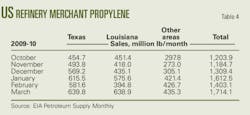
Comparison of ratios of refinery propylene sales to FCCU feed rates showed dramatic increases in first-quarter 2010 for refineries in the Texas Gulf Coast and South Louisiana. In fourth-quarter 2010, the ratio of production to FCCU feed for the Texas Gulf Coast averaged 6.9%. In first-quarter 2010, the ratio jumped to 8.9%. Typically, FCCUs have a propylene yield of 5.5-6.5 vol % during winter and 6.5-7.5% during summer. Similarly, the propylene ratio for refineries in South Louisiana averaged 7.9% in fourth-quarter and increased to 10.3% in first-quarter 2010 (Table 4).
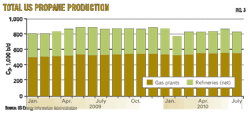
Total domestic propylene supply totaled 7.13 billion lb in first-quarter 2010 and was 1.26 billion lb higher than in fourth-quarter 2009, if EIA's refinery propylene statistics are accurate. Petral estimates for coproduct propylene production during second-quarter 2010 indicate US propylene supply declined by at least 300 million lb, but uncertainty regarding refinery-propylene supply may outweigh the decline in coproduct propylene.
Fig. 3 illustrates trends in coproduct and refinery merchant propylene sales.
Ethylene production costs
Ethane and propane accounted for about 79% of total ethylene production in first-half 2010. Industry composite production costs are largely determined by production costs for ethane and propane.
Production costs for ethylene in the Houston Ship Channel (assuming full spot prices for all coproducts) based on purity ethane feeds averaged about 28¢/lb in first quarter but declined to 20¢/lb in second-quarter 2010. Production costs based on ethane for first-quarter 2010 were about 3¢/lb higher than in fourth-quarter 2009.
In first-quarter 2010, purity ethane provided ethylene producers with cost savings of 4-5¢/lb compared with naphtha in January and March, but ethane was 1-2¢/lb more expensive in February. In second-quarter 2010, incentives to maximize ethane consumption compared with naphtha averaged 15¢/lb in April and averaged 11-12¢/lb for the quarter.
Production costs for purity propane averaged 29-30¢/lb in first-quarter 2010 but fell to 20¢/lb in March from 36-37¢/lb in January. The production cost average for first-quarter 2010 was about 1¢/lb higher than for fourth-quarter 2009. In second-quarter 2010, production costs based on propane averaged 23¢/lb.
Propane provided ethylene producers with an average incentive of 1¢/lb relative to light naphtha during first-quarter 2010, but economic incentives to use propane widened to 10¢/lb in second-quarter 2010.
Average production costs for natural gasoline during first-quarter 2010 averaged 30-31¢/lb and were almost 3¢/lb higher than ethane but within 1¢/lb of parity with propane. In second-quarter 2010, ethylene production costs based on natural gasoline increased to 33¢/lb. Natural gasoline and other light naphthas of similar quality suffered a cost disadvantage of 10-13¢/lb, compared with ethane and propane during second-quarter 2010.
Table 5 summarizes trends in ethylene production costs.
Ethylene pricing, margins
A few olefin plants experienced unplanned downtime and a few others were out of service for maintenance. Ethylene inventories were minimal during first-quarter 2010 and incremental ethylene supply was very tight. As a result, contract prices for ethylene surged during first-quarter 2010 and averaged 52.25¢/lb compared with 40.25¢/lb in fourth-quarter 2009. The contract benchmark price in first-quarter 2010 peaked at 55.5¢/lb and was 15.25¢/lb higher than the average for fourth-quarter 2009.
After April, ethylene producers began to resolve operating problems and completed turnarounds. As a result, contract prices dipped to 52.5¢/lb in April and fell to 44.75¢/lb in May. The contract for June settled at 39.5¢/lb and averaged 45.6¢/lb for second-quarter 2010.
Trends in spot ethylene prices even more dramatically highlighted the impact of operating problems in first-quarter 2010. From a fourth-quarter 2009 average of 33¢/lb, spot prices spiked to the March average of 63.5¢/lb. During March, incremental supply sold for as high as 72¢/lb.
As ethylene producers resolved problems and completed turnarounds, availability in the spot market improved dramatically. Spot prices in April averaged 62¢/lb but prices fell to 40.5¢/lb in May and dipped to 31¢/lb in early June. By mid June, however, prices were slightly stronger at 32-33¢/lb. Spot prices averaged 32.5¢/lb for June and averaged 45.2¢/lb for second-quarter 2010.
Margins based on the contract benchmark prices were much stronger for all feedstocks in first-quarter 2010 than in fourth-quarter 2009. Margins based on purity-ethane production costs averaged 24.6¢/lb compared with 15.1¢/lb for fourth-quarter 2009. Margins based on propane averaged 23.0¢/lb and were 11¢/lb higher than for fourth-quarter 2009.
Ethylene producers that continued to crack natural gasoline and light naphthas also had large improvements in profitability. Profit margins for natural gasoline feeds averaged 22.0¢/lb in first-quarter 2010, compared with 8.2¢/lb in fourth-quarter 2009.
Since contract benchmark prices remained strong for most of second-quarter 2010, profit margins for ethane were even better than in first-quarter 2010. Profit margins improved to 26.1¢/lb based on purity ethane. Profit margins for propane also improved in second-quarter 2010 and averaged 23.7¢/lb. Margins based on natural gasoline, however, narrowed to 14.4¢/lb for second-quarter 2010 and were 7.6¢/lb lower than the average for first-quarter 2010.
Profit margins based on the contract benchmark are usually stronger than margins based on spot ethylene prices, but spot prices were much stronger than contract benchmark prices during first-quarter 2010 due to the scramble for incremental pounds of product. Profit margins based on spot ethylene prices and purity-ethane production costs reached a peak of 40-42¢/lb in March and April, compared with 15¢/lb in January. Spot ethylene prices yielded an average margin of 26.2¢/lb for first-quarter 2010 and 25.0¢/lb for second-quarter 2010.
Profit margins for purity propane reached a peak of 43.3¢/lb in March 2010, compared with only 8.7¢/lb in January. As spot prices began to erode, margins based on purity propane narrowed to 39¢/lb in April and dropped to 19¢/lb in May. Margins based on purity propane averaged 22.1¢/lb for second-quarter 2010.
Fig. 4 shows historic trends in ethylene prices (spot prices & net transaction prices). Fig. 5 illustrates profit margins based on contract ethylene prices and composite production costs.
Refinery, polymer-grade C3=
During first-quarter 2010, spot prices for refinery-grade propylene increased by 6.3¢/lb and reached a peak of 57.6¢/lb in March. For first-quarter 2010, refinery-grade propylene prices averaged 54.4¢/lb and were 10.2¢/lb higher than during fourth-quarter 2009.
Refinery-grade propylene prices began to erode in April and were 9.4¢/lb lower than in March. Prices declined by an additional 6.8¢/lb in May but declined by only 2¢/lb in June. For second-quarter 2010, spot prices for refinery-grade propylene averaged 43.0¢/lb, or 11.4¢/lb lower than the average for first-quarter 2010.
The premium for refinery-grade propylene prices compared with unleaded regular gasoline prices averaged 21.2¢/lb for first-quarter 2010 compared with 13.2¢/lb for fourth-quarter 2009. Premiums for refinery-grade propylene compared with unleaded regular for second-quarter 2010 averaged 9.1¢/lb.
Operating problems and olefin plant turnarounds also had a major impact on prices for polymer-grade propylene. The contract benchmark for polymer-grade propylene settled at 57¢/lb for January 2010 but jumped to 63.5¢/lb in February and 68.5¢/lb in March. The contract benchmark for polymer-grade propylene averaged 63¢/lb for first-quarter 2010 and was almost 13¢/lb higher than the average for fourth-quarter 2009.
In April, propylene buyers agreed to a third major increase in the contract benchmark for polymer-grade propylene. After settling at the April benchmark at 75.5¢/lb, prices for polymer-grade propylene came under intense bearish pressure. The contract benchmark settled at 63.5¢/lb for May and fell to 55.5¢/lb for June.
The full impact of the surge in propylene prices is measured by the surge in premiums for polymer-grade propylene compared with refinery-grade propylene. In fourth-quarter 2009, contract benchmarks for polymer-grade propylene were 6.0¢/lb higher than spot prices for refinery-grade propylene.
During first and second quarters 2010, premiums for polymer-grade propylene increased to 10.9¢/lb in March and jumped to 27¢/lb in April. For first-quarter 2010, premiums compared with refinery-grade propylene averaged 9.4¢/lb. For second-quarter 2010, premiums averaged 21.8¢/lb.
Second-half 2010 outlook
Although supply-demand fundamentals were generally bearish for crude oil prices globally, West Texas Intermediate prices increased to a peak of $86/bbl in early April. Various factors contributed to the steady and moderately bullish trend in crude oil prices.
First, crude oil traders who focus on trends in the value of the US dollar compared with the Euro generally contribute to rising crude oil prices when the Euro is strong. Until the Greek bailout crisis in May led to a sharp decline in the value of the Euro, traders in this category supported rising crude oil prices.
Second, the outlook for global economic activity was generally positive and encouraged pension-fund money to flow into commodity index funds. Since the New York Mercantile Exchange sweet crude contract is the largest commodity in the most widely traded commodity index fund, financial problems in Europe undermined this confidence after April.
The 3-week correction during May pushed WTI prices to discounts of $2-5/bbl compared with other global crude oil benchmarks. The correction ran its course, however, and WTI prices began to rebound before the end of May.
From a global fundamental supply perspective, Petral estimates indicate OPEC production was about 200,000 b/d surplus to global demand during second-quarter 2010. Petral expects global supply/demand fundamentals to remain bearish for the remainder of 2010 and WTI prices to succumb to bearish pressure during fourth-quarter 2010. WTI prices will average $75-80/bbl during third-quarter 2010 and $70-75/bbl during fourth-quarter 2010.
Spot prices for ethane were under substantial bearish pressure during second-quarter 2010 as a result of the temporary decline in demand due to turnarounds. Based on a rebound in feedstock demand during third-quarter 2010 and gradually tightening ethane availability, ethane prices are likely to rally during third and fourth quarters 2010. The rally in ethane prices will spill over into the propane market, and propane prices will also rebound.
Ethylene production costs based on ethane and propane will average 24-28¢/lb during third-quarter 2010 and 25-30¢/lb during fourth-quarter 2010. Variable production costs based on natural gasoline will average 30-32¢/lb during third and fourth quarters 2010.
Petral forecasts call for spot ethylene prices to average 34-37¢/lb during third-quarter 2010 and 35-38¢/lb during fourth-quarter 2010. Profit margins will average 10-12¢/lb for purity ethane and 6-8¢/lb for purity propane.
The author
More Oil & Gas Journal Current Issue Articles
More Oil & Gas Journal Archives Issue Articles
View Oil and Gas Articles on PennEnergy.com

