OGJ FOCUS — FOURTH QUARTER 2009, FIRST QUARTER 2010: US, Canadian propane supply, demand reverse YOY declines
Winter 2009-10 in the US was in stark contrast to the previous winter in terms of both propane supply and consumption.
Propane supply, heavily curtailed by disruptions from Hurricane Ike in September 2008, was at full rates. Gas plant production, in particular, was the highest since 2001.
On the propane demand side, US ethylene feedstock demand, driven by the strong rebound in ethylene industry production after first-quarter 2009, was much stronger than during the previous winter. In additional, colder weather prompted stronger propane sales into space-heating markets.
Finally, waterborne exports from Houston Ship Channel terminals set record highs throughout the winter heating season.
Feedstock demand
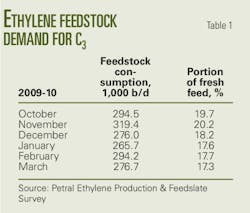
During fourth-quarter 2009, Petral survey results showed that feedstock demand for propane declined by 17,000 b/d, compared with consumption during third-quarter 2008, and averaged 297,000 b/d. The typical seasonal decline in demand is in the range of 50,000-70,000 b/d.
More importantly for supply-demand and inventory trends during the winter heating season, however, feedstock demand in fourth-quarter 2009 was 104,000 b/d higher than in fourth-quarter 2008. The year-over-year (YOY) increase in feedstock demand during fourth-quarter 2009 totaled 9.6 million bbl.
Based on Petral data for all feedstocks, propane's share of fresh feed averaged 19.3% during fourth-quarter 2009 vs. 20.8% during third-quarter 2009, 18.7% during second-quarter 2009, and 14.9% during fourth-quarter 2008.
Typically, feedstock demand rebounds during the first quarter from its seasonal low of the fourth quarter. During winter 2009-10, however, feedstock demand for propane declined further during first-quarter 2010. Demand averaged 275,000-285,000 b/d during first-quarter 2010 and was about 20,000 b/d lower than the average for fourth-quarter 2009.
Feedstock demand for propane is an important balancing element for the overall propane market in North America. When colder weather pushes sales and consumption in the retail markets steadily higher, ethylene producers in the Gulf Coast have substantial capability to reduce their consumption and effectively offset some or all of the impact of a colder than normal winter. Historically, most of the seasonal decline in ethylene feedstock demand has occurred during fourth quarter. Frequently, feedstock demand for propane rebounds during first quarter. |
Despite the quarter-to-quarter decline, demand in first-quarter 2010 averaged 48,000 b/d more than in first-quarter 2009. The quarterly decline in feedstock demand helped to offset strong demand in retail heating markets and strong waterborne exports.
Table 1 summarizes trends in ethylene feedstock demand for propane.
We recognize that economists will continue to debate the prospect of a double-dip recession or a protracted recession for another year. From the perspective of petrochemical and midstream companies, however, the recovery in ethylene industry operating rates that began in second-quarter 2009 was sustained during second-half 2009 and into first-quarter 2010.
Ethylene producers operated at 84% of capacity in fourth-quarter 2009 and at 87% of capacity for first-quarter 2010. Ethylene producers will likely operate at 88-92% of capacity during second and third quarters 2010. On this basis, total demand for fresh feed will average 1.60-1.65 million b/d. Feedstock demand for propane will be 320,000-350,000 b/d during second and third quarters 2010 and propane's share of fresh feed will average 20-21%.
Fig. 1 shows historic trends in ethylene feedstock demand for propane.
Retail demand
Temperatures were 2-7% warmer than the previous winter for all eastern regional markets during fourth-quarter 2009 and were 4-14% warmer during first-quarter 2010. In the Gulf Coast, Rocky Mountains, and West Coast, however, heating degree-days in fourth-quarter 2009 were 12-15% higher than in fourth-quarter 2008.
Similarly, heating degree-days for all eastern markets during first-quarter 2010 were 8% lower than first-quarter 2009 but heating degree-days for Gulf Coast, Rocky Mountains, and West Coast markets were 15-45% higher than in 2009.
We estimate that total retail propane sales averaged 814,000 b/d in fourth-quarter 2009, or 5,000 b/d higher than in fourth-quarter 2008. We estimate that total retail propane sales increased to 1.07 million b/d in first-quarter 2010 vs. 1.05 million b/d in first-quarter 2009. Total retail sales were 2.3 million bbl higher than during the previous winter heating season.
Normally, differentials between Mont Belvieu prices and posted prices for the important international benchmarks do not provide economic incentives for international consumers and trading companies to purchase large volumes of propane from the US.
During winter 2009-10, however, and in stark contrast to previous winters, propane exports from the Gulf Coast averaged 105,000 b/d (9.7 million bbl) during fourth-quarter 2009 vs. 27,000 b/d (2.5 million bbl) during fourth-quarter 2008.
Propane exports remained heavy during first-quarter 2010 and averaged 90,000-95,000 b/d vs. 86,000 b/d during first-quarter 2009. The YOY increase in propane exports totaled about 7.8 million bbl and was a major factor in liquidating surplus inventories particularly during fourth-quarter 2009.
Propane supply
Propane prices rose in concert with the strong rebound in crude oil prices during second-half 2009. As the recovery in crude oil prices carried over into first-quarter 2010, propane prices in Mont Belvieu also continued to rise. Profit margins for propane recovery from gas processing plants were strong during fourth-quarter 2009 and first-quarter 2010 as were profit margins for ethane recovery. With strong margins and no economic incentive to reject ethane, most gas plants operated at full recovery.
| Propane's use as a space heating fuel in residential and commercial markets reaches its seasonal peak each year during fourth and first quarters. Residential and commercial propane demand begins to increase during September and October and usually reaches peak demand during December and January. |
For refineries, economic incentives to move propane into the merchant market were also strong. Propane prices averaged $11-14/MMbtu, or $6-8/MMbtu higher than natural gas prices during fourth-quarter 2009 and first-quarter 2010.
Refineries had no incentive to burn propane instead of natural gas during the winter heating season. Instead, refineries had very strong incentives to sell propane and buy natural gas. The economic incentives prompted questions regarding reports from the US Energy Information Administration of a sharp decline in refinery production.
Based on data published by EIA, total production from US gas plants and net propane production in fourth-quarter 2009 from refineries averaged about 877,000 b/d, or 74 ,000 b/d (6.8 million bbl) more than a year earlier.
In first-quarter 2010, EIA showed total supply averaged 815,000 b/d. With Petral adjustments to refinery propane supply, we estimate total supply averaged 830,000-850,000 b/d/ for first-quarter 2010. Domestic production will average 875,000-885,000 b/d during second and third quarters 2010 (subject to revisions based on the impact of reporting changes by some refiners of their volumes of propane-propylene mix).
These volumes compare favorably with 877,000 b/d of total domestic production during second and third quarters 2009. For winter 2009-10 (October 2009 through March 2010), US propane production totaled about 161 million bbl, or 9 million bbl more than during the previous winter heating season.
Gas plants
EIA's statistics indicate that gas plants' propane production averaged 551,000 b/d for fourth-quarter 2009 and was 52,000 b/d more than production a year earlier. With no hurricane-related natural gas curtailments in the Gulf of Mexico and no ethane rejection, gas plants' propane recovery during fourth-quarter 2009 was highest of any fourth quarter since 2001.
Furthermore, gas plants' propane production during fourth-quarter 2009 was 11,000 b/d higher than in third-quarter 2009. Typically, seasonal condensation in gas gathering pipelines reduces propane recovery during fourth quarter. Gas plants' propane production in the Rocky Mountains and Texas has been growing since 2007; this trend offsets the typical seasonal reduction in propane recovery.
In first-quarter 2010, gas plant production averaged 546,000 b/d and was 31,000 b/d more than in first-quarter 2009.
We expect gas plants' production to average 530,000-545,000 b/d in second and third quarters 2010. Fig. 2 illustrates trends in propane production from gas plants.
Refineries
In fourth-quarter 2009, EIA said, propane production from refineries (net of propylene for propylene chemicals markets) averaged 327,000 b/d and were 4,000 b/d lower than net refinery supply in third-quarter 2009 but 22,000 b/d higher vs. a year earlier.
| Beginning in January 2010, a few refining companies with plants in the Texas Gulf Coast, South Louisiana, and the upper Midwest changed how they reported components for mixed composition propane/propylene streams to the EIA. These changes affected the reported propane supply from refineries and net availability to the merchant market. Based on preliminary discussions with EIA personnel, these refineries now report their propane/propylene streams to EIA as 100% propylene. Previously, these companies reported to EIA mixed composition streams as 100% propane. This topic will be the subject of extensive discussion by the NGL Market Information Committee of the Gas Processors Association and between the committee and the EIA. Furthermore, this issue highlights the inherent uncertainty of the reported statistics of refinery propane supply. |
Based on EIA's published statistics, net propane from refineries dropped sharply in January 2010 and averaged 244,000 b/d, or 84,000 b/d lower than in December 2009. Net propane from refineries in January 2010 was also 61,000 b/d lower than in January 2009.
EIA statistics for first-quarter 2010 showed propane production averaged 268,000 b/d, or 59,000 b/d less than fourth-quarter 2009 and 36,000 b/d less than first-quarter 2009. Refinery operating rates for first-quarter 2010 do not support the decline in net propane production in first-quarter 2010 vs. 2009.
We estimate that actual net propane from refineries was probably 270,000-290,000 b/d after correcting for changes in reporting of mixed-composition propylene/propane streams by a few refiners.
We expect propane supply from refineries to average 325,000-335,000 b/d in first and second quarters 2009. Fig. 3 shows trends in total propane production (gas plants and refineries).
Imports
Based on data published by the US Census Bureau's Foreign Trade Division, total propane imports averaged 160,000 b/d during fourth-quarter 2009, and propane imports from Canada averaged 119,000 b/d in fourth-quarter 2009.
| Consistent with the seasonal increase in retail propane sales, propane imports from Canada typically increase to peak seasonal volumes of 150,000-175,000 b/d during fourth quarter and 170,000-190,000 b/d during first quarter. In addition, propane imports from international sources (outside North America) usually decline sharply during fourth quarter. Imports from international sources typically remain at seasonally minimum levels during first quarter. |
Total propane imports for fourth-quarter 2009 were 13,000 b/d lower than in fourth-quarter 2008. Propane imports from Canada averaged 119,000 b/d and were 15,000 b/d lower than in fourth-quarter 2008.
In first-quarter 2010, total propane imports increased to 181,000 b/d, or 21,000 b/d more than in fourth-quarter 2009 but 16,000 b/d less than in first-quarter 2009. Imports from Canada increased to 129,000 b/d in first-quarter 2010, or 10,000 b/d more than in fourth-quarter 2009 but were 27,000 b/d less than in first-quarter 2009.
Inventory trends
During third-quarter 2009, the YOY inventory surplus narrowed to 16 million bbl at the end of September from 22 million bbl at the end of July. From a broader perspective, the inventory surplus relative to the 5-year average peaked at 20 million bbl at the end of June 2009 and had narrowed to 12.6 million bbl at the end of September 2009.
During the first half of the 2009-10 winter heating season, speculation was widespread that the surplus inventory problem would persist throughout the 2009-10 winter heating season and into the winter heating season 2010-11. As is usual, however, the seasonal increase in retail propane sales, the ethylene industry's feedstock demand for propane, and the extensive export capabilities in the Houston Ship Channel combined to liquidate the inventory surplus before the end of December 2009.
Nov. 1 normally marks the beginning of the inventory-liquidation season for the US, but inventories in Canada typically begin to decline after late August or early September. Occasionally, however, propane inventories in the US have not reached their seasonal peak until mid to late November.
In fourth-quarter 2009, propane inventory in primary storage reached its seasonal peak of 73 million bbl (excluding nonfuel propylene) during the second week of October, or 3-5 weeks sooner than usual.
For North America, inventories reached a seasonal peak of 87.3 million bbl at the end of September 2009, or 17 million bbl more than the inventory peak in 2008. By December 2009, inventories in Canada and the US fell to 56.6 million bbl and were 5.2 million bbl lower than the end of December 2008. The liquidation of inventories during fourth-quarter 2009 resulted in a cumulative YOY swing of 23 million bbl, to a deficit of 5 million bbl from a surplus of 18 million bbl.
During a typical winter, propane markets require 40-44 million bbl of inventory to be withdrawn from primary storage in the US and 8-10 million bbl from primary storage in Canada. Based on EIA's monthly inventory reports for October 2009 through March 2010, inventories of purity propane in the US declined by 47.6 million bbl during the winter heating season 2009-10.
The cumulative inventory withdrawal exceeded the historic norm even though total production was higher than during the previous winter. First, total retail sales were 8 million bbl more than during the previous winter. Second, the YOY increase in ethylene feedstock demand was enough to offset higher domestic production during fourth-quarter 2009. Finally, waterborne exports from the Houston Ship Channel exceeded typical winter volumes by a wide margin.
Canada's National Energy Board's report on inventory in underground storage showed that purity propane inventories in Canada reached a peak of 10.3 million bbl on Oct. 1, 2009, or 1.4 million bbl more than a year earlier but only 0.5 million bbl more than the 5-year average.
Based on monthly reports from the NEB, Canadian companies withdrew 8.4 million bbl of propane from primary storage during the winter heating season. Inventories of purity propane fell to a seasonal low of 1.8 million bbl at the end of March 2010. Purity propane inventories in Canada at the end of March were 2.0 million bbl lower than the 5-year average and 1.2 million bbl lower than a year earlier.
Fig. 4 illustrates trends in propane inventory in US storage; Table 2 presents US inventories by US Petroleum Administration for Defense District. (See accompanying box on this page for an explanation of PADDs.)
Regional inventory trends
Propane inventory in primary storage in PADD II peaked during the first week of October 2009 and totaled 31.3 million bbl, or 6.4 million bbl more than peak inventory in 2008 and 1.3 million bbl more than the average for 2002-06. By the end of March 2010, inventory in primary storage in PADD II declined to 10.1 million bbl, 0.7 million bbl more than the 5-year average.
Propane inventory in primary storage in PADD III (excluding nonfuel propylene) reached its peak at the end of September 2009 and totaled 34.0 million bbl, or 5.2 million bbl more than the peak inventory level of 2008. By the first week of December 2009, inventory in PADD III had declined by 4.5 million bbl and was 1.5 million bbl less than a year earlier.
By the end of February 2010, inventory in primary storage in PADD III declined to 11.1 million bbl and was 9.4 million bbl less than in 2009.
Propane in PADD III storage increased to 12 million bbl at the end of March 2010, 7.5 million bbl less than for March 2009.
Pricing, economics
During fourth-quarter 2009, West Texas Intermediate crude prices averaged $76.07/bbl and were almost $8.00/bbl higher than the average for third-quarter 2009. During fourth-quarter 2009, however, WTI prices moved in a narrow, $74-78/bbl range.
During first-quarter 2010, WTI prices averaged $78.67/bbl and were $2.60/bbl higher than the fourth-quarter 2009 average. During first-quarter 2010, WTI prices increased to $81.26/bbl in March 2010 from $74.41/bbl in December 2009. The increases in WTI prices set the economic basis for propane price trends.
In October 2009 (the beginning of the heating season), propane prices in Mont Belvieu averaged 102.5¢/gal and were almost 12¢/gal higher than in August 2009. In December 2009, propane prices had increased to 121.9¢/gal and were 18.9% higher than in October 2009.In contrast, WTI prices declined by $3.65/bbl, or 4.7% from November to December. The price ratio of propane vs. WTI averaged 55.7% in October 2009 but increased to 67.4% in December 2009.
For third-quarter 2009, propane prices averaged 86.8¢/gal but feedstock parity values vs. light naphthas averaged 94.9¢/gal. In fourth-quarter 2009, propane prices averaged 109.0¢/gal, but feedstock parity values vs. light naphthas averaged 115.8¢/gal. These comparisons indicate that, despite the rally in propane prices relative to WTI prices, propane remained economically attractive to ethylene producers in Louisiana and Texas.
During first-quarter 2010, propane prices in Mont Belvieu peaked at 131.8¢/gal in January and declined to 113.3¢/gal in March. Propane's price ratio vs. WTI increased to 70.7% in January and averaged 70.5% in February. As retail propane sales began a sharp decline, however, propane's ratio vs. WTI dropped to 58.5% in March. The price peak in January 2010 coincided with peak demand in retail propane sales.
From the perspective of ethylene producers, propane lost its economic advantage vs. light naphtha during January and February. In January, propane's feedstock parity values vs. light naphtha averaged 129.3¢/gal, or 2.5¢/gal less than the Mont Belvieu spot price. In February, feedstock parity values vs. natural gasoline averaged 123.1¢/gal, or 5.3¢/gal less than the Mont Belvieu spot price.
Propane prices fell sharply during March despite the increase in WTI prices, partly due to end of the winter heating season. Ethane prices also fell sharply in March, however, and propane's feedstock parity value vs. ethane declined to 118.6¢/gal in March 2010 from 125.4¢/gal in February 2010.
Spring, summer prices
During July 2009 through April 2010, WTI prices increased by about $20/bbl, or 31.7%. To some extent, WTI prices increased due to growing concerns over Iran's push for nuclear weapons.
During May, two factors precipitated a sharp decline in WTI prices. First, turmoil in Europe over the financial bailout of Greece reduced the value of the Euro vs. the US dollar. Second, the US began to have some success in its diplomatic initiatives to halt Iran's development of nuclear weapons. The reduction in international tensions would tend to be bearish for crude oil prices. Finally, US crude oil supply/demand fundamentals have been persistently neutral to slightly bearish during July 2009 through April 2010.
For traders who determine their crude positions based on variations in the Euro vs. the US dollar, WTI prices had to weaken. For traders who focus on risks to the flow of oil from the Middle East, the reduction in tensions between Iran and the US also had major bearish implications. These bearish factors, however, had measurably more impact on WTI prices than on prices for other benchmarks.
During second-quarter 2010, market forces will resolve the aberrations in pricing differentials between WTI and other benchmarks such as Brent and Dubai/Oman. WTI prices will average $75-80/bbl during second-quarter 2010 and $70-75/bbl during third-quarter 2010.
Prices for natural gasoline will peak at 180-190¢/gal, and feedstock parity values for propane will reach 130-135¢/gal in second-quarter 2010 and 145-155¢/gal in third-quarter 2010.
Furthermore, spot ethane prices were weak during April and May due to the impact of a series of ethylene plant turnarounds. During third-quarter 2010, ethane prices are likely to rebound and will provide bullish support for a rally in propane prices in Mont Belvieu.
During third-quarter 2010, spot propane prices in Mont Belvieu will likely recover from the weakness of the second and reach 125-135¢/gal during third-quarter 2010 vs. an average of 112-116¢/gal for second-quarter 2010.
During second and third quarters 2010, ethylene producers will have an average incentive of 5-7¢/gal. This incentive will support the expected increase in feedstock demand. Finally, the propane/WTI ratio will average 72-75% during third-quarter 2010 vs. 62-64% during second-quarter 2010.
The author
More Oil & Gas Journal Current Issue Articles
More Oil & Gas Journal Archives Issue Articles
View Oil and Gas Articles on PennEnergy.com
