GULF COAST ECONOMIC LIMITS—1: Economic limits estimated for US gulf coastal fields
When the revenue generated from an oil and gas field is less than the cost of operation, the field is no longer considered an asset and production ceases. Capital investment may be made in an attempt to increase production or the field may be divested or abandoned.
Economic limits are a common industry metric but are often considered from a conceptual perspective rather than as an object for empirical computation.
The purpose of this four-part series is to compute the economic limits in Texas, Louisiana, and the Gulf of Mexico federal Outer Continental Shelf. This region contributed over half the oil and gas production in the US in 2009 and is the nation's largest oil and gas producing region.
We begin Part 1 by describing the resources and production of Texas, Louisiana, and the federal OCS. Information on paying quantity rules, reservoir and field classifications, and operating cost is also provided. Development of the methodological framework concludes the discussion.
Economic limit as a proxy
Economic limits provide useful operational information because they indicate the value (and hence the time) when production is no longer commercial. Economic limits also serve as key input in production forecasts and revenue models.
Oil and gas fields have unique geologic characteristics and development strategies; are located in areas of diverse terrain, accessibility, and environmental conditions; produce different quality streams; and have different labor, equipment and material cost. Economic limits are therefore expected to vary with these and other factors.
The economic limit serves as a proxy for rational decision-making, and as with all proxy measures, the correspondence is not perfect.
An operator may shut-in wells before the economic limit is reached if they decide for strategic reasons to exit the region or a hurricane/blowout prematurely destroyed the facilities.
An operator may produce for a period of time after the economic limit is reached, if it intends further drilling on the property, can postpone maintenance and workover requirements, or believes future prices will enable a return to profitability. Many times wells are held inactive in anticipation of a future sidetrack opportunity.
An operator that produces from a lease at a loss to delay the cost of abandonment is in violation of its obligation to produce in "paying quantities," but absent a challenge by the leaseholder, this will often go unnoticed.
Ultimately, the criteria operators employ to cease operations is unobservable, but that does not negate application of the economic limit as a proxy for commercial operations.
Resources and production
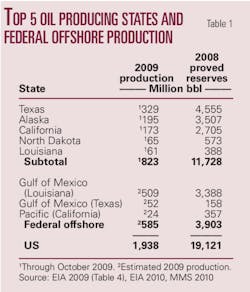
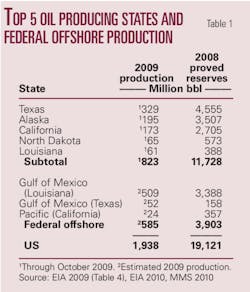
Texas is the largest producing state of both oil and gas. Texas averaged 900,000 b/d of oil and 19 bcf of gas a day in 2009, or 20% of US oil output and nearly one third of US gas output.1 2
Texas crude oil reserves represent about one fourth of the US total, and gas reserves account for over three-tenths of the US total.3 Texas also accounts for about 40% of the country's gas liquids production and reserves3 (Tables 1-3).
The gulf OCS is the largest single US oil producing region. In 2009, OCS lands averaged 1.5 million b/d and 5.2 bcfd,4 roughly 29% and 11% of US totals, respectively. OCS crude oil reserves represent 19% and gas reserves 5% of the US total.
Louisiana ranks fifth in oil production and fourth in gas production in the US. The state has 2% of the US proved oil reserves, 5% of proved gas reserves, and 3% of NGL reserves.
In 2009, Texas, Louisiana, and the gulf federal OCS contributed half of all oil and gas production and 58% of gas liquids production in the US. The region is estimated to contain 44% of US crude oil reserves, 42% of gas reserves, and 48% of NGL reserves.
Production in paying quantities
An oil and gas lease is an economic transaction between two parties to produce profitably, and when a lease is no longer profitable it should terminate. What profitability entails, however, varies by jurisdiction.
Mineral law is considered part of real estate (case, or common) law which is determined by historical precedents established in court. Since each state has its own court system, each state has different laws regarding paying quantity rules.
Texas
In Texas, paying quantities is determined under a two-pronged test developed by the courts.5 6
• Accounting or litmus test—Do operating revenues exceed operating costs over a reasonable period? This test looks backward in time, and if the lessor cannot meet the burden of proof, the case is over.
• Reasonable prudent operator test—Would a reasonable prudent operator, seeking to make a profit and not holding for mere speculation or to delay cleanup obligations, continue to operate under the circumstances? This test looks forward and is usually considered a fact question.
In the "litmus test" the court determines if operating revenues are greater than operating costs over a reasonable time period (6 to 18 months is common) to determine whether operations have been "profitable."
If operations are evaluated as profitable, the inquiry is ended, and the lease is held to be producing in paying quantities. If the court concludes that operating revenues have not exceeded costs over a reasonable time, it applies a "legal test" and asks whether there is any reason that a reasonably prudent operator who expected to make a profit would continue operating it. Only if the answers to both prongs of the test are negative does the lease terminate.
Louisiana
The Louisiana Mineral Code Article 124 defines production in paying quantities as follows:
"When a mineral lease is being maintained by production of oil or gas, the production must be in paying quantities. It is considered to be in paying quantities when production allocable to the total original right of the lessee to share in production under the lease is sufficient to induce a reasonable prudent operator to continue production in an effort to secure a return on his investment or to minimize any loss."
Outer Continental Shelf
In the OCS, the Minerals Management Service, the federal agency responsible for regulating offshore energy production, defines paying quantities7 as the production of oil and gas to yield a:
"Positive stream of income after subtracting normal expenses (i.e., operating cost) which include the sum of: (a) minimum royalty or actual royalty payments, whichever is greater, and (b) the direct lease operating costs. Direct lease operating cost includes processing fees, labor costs, fixed and variable operating cost incurred on a lease, and fixed and variable operating cost allocated to the lease when the production is processed off lease."
Reservoir classification
Reservoirs are classified by their production mechanism and fluid type. Reservoir fluid is determined by the initial conditions of the reservoir and its pressure-temperature phase diagram. Five reservoir fluids are generally identified, corresponding to the initial conditions of the deposit: black oil, volatile oil, retrograde gas, wet gas, dry gas.8
The ratio of gas to oil production is referred to as the producing gas-oil ratio (GOR) and is expressed in terms of standard cubic feet (scf) per stock tank barrel (stb).
For reservoirs with GOR <2,000 scf/stb, the fluid is a dark, heavy, black oil, with API gravity typically less than 45°. Fields that produce crude with gravity less than 25° often have low reservoir pressure, low GOR, and experience high water cuts later in field life.
Volatile oils are light oils with GORs in the range from 2,000 to 3,300, while retrograde gas has GORs from 3,300 to 50,000 and gravity ranging from 40° to 60°. Dry gas wells have GOR >50,000. High GOR streams require chokes to limit drawdown and sand production.
In Texas, the process of classifying a field as an oil field, a gas field, or an oil and gas field depends initially on the GOR of the first well but may also result from administrative hearings. In Louisiana and the OCS, we use cumulative GOR <5,000 to define an oil field; a CGOR threshold between 5,000 and 15,000 to classify oil/gas fields; and a GOR >15,000 to define a gas field.
Field classification
A field is defined as the surface area directly above one or more producing reservoirs all related to the same geologic structural feature and-or stratigraphic condition. There may be two or more reservoirs in a field that are separated vertically by impervious strata or laterally by local geologic barriers or by both.
Fields are laid down and form through a number of different geologic processes, but the rules by which states and the federal government identify fields follow common principles.
The Field Designation Section of the Oil and Gas Division of the Texas Railroad Commission, the Louisiana Office of Conservation, and the Field Naming Committee of the MMS review producing leases and production information submitted by operators, logs, geophysical data, geologic maps and other data to establish the existence of a new field or the extension of an existing field.
Structural lows, for example, are used to separate fields with structural trapping mechanisms. In Fig. 1, the structural low between two anticlinal features is sufficient to designate two separate fields.9
In Fig. 2, depicting a piercement salt dome with traps against the salt and a fault trap down on the flank, blocks 2, 3, 4, and 13 would all be considered on the same structure and therefore in the same field even though the blocks are not contiguous.9
The structure or stratigraphic condition with pay having the largest areal extent determines field expanse, and reservoirs that overlap vertically are usually combined into a single field. Faults are rarely used to separate fields, no matter how large or the degree of vertical separation of reservoirs.
A new field is usually designated after the location of the discovery well, and over time, the area encompassed by a field may be revised. As new wells are drilled and geographic data reviewed, the field area will be revised to include additional lease units on a geologic structure and lease units that have been proven productive by drilling.
As new geological information becomes available, the reservoir is remapped and unit boundaries are redefined. New units are established by dissolving old boundaries and the process repeats.
Operating cost
In conventional production, the volume of water produced will usually increase over time and the volume of oil and gas will decline.
As pressure declines and eventually dissipates, oil will no longer flow to the surface naturally, and must be pumped using "artificial lift" and "secondary" and "tertiary" production methods, such as waterflooding and carbon dioxide flooding, if economically viable. At some point, revenue will not be sufficient to cover the operational cost and the well will be shut in.
For oil fields, the cost of water separation and disposal are often determining factors. Gas wells are abandoned when the reservoir pressure declines to the point where the cost of compression is no longer economical.
The cost of operating treatment and disposal facilities includes chemical additives and utilities; the cost of managing residuals or byproducts resulting from the treatment; permitting, monitoring, and reporting costs; and transportation costs.10
Operating cost change with commodity prices (lease fuel), age (chemical treatment and monitoring, corrosion and scale), the number and type of wells and structures, product mix (oil, oil-gas, gas), production characteristics (gas lift, water injection, gas injection), water production, distance to market, well servicing requirement (workovers), and if offshore, distance to port (boat and helicopter transportation) and insurance requirements.
Labor, transportation, well servicing, and contract services are the main expenses. Fuel, chemicals, surface repair and maintenance are usually secondary. Age of structure influences repair and maintenance requirements. Mature production is the most expensive for handling, chemicals, and well servicing.
Produced water is treated to remove the latent oil and gas and is injected back into the reservoir or deposited offsite. Disposal cost varies with environmental conditions and distance to processing facilities.11
In bays-estuaries and state waters, produced water cannot be disposed of in a marine environment, and must either by transported to a disposal facility or injected in a disposal well. In federal waters, produced water can be disposed offshore if environmental specifications are satisfied.
Factors in economic limits
Many factors impact operating cost and the determination of economic limits.
Two of the most important factors are product type and terrain, and fortunately, these factors are part of the public record. The relative price of oil and gas and the market premium of crude oil also play an important role in economic limit comparisons.
Product type
Product type is important because characteristics of the output stream influence operating cost and revenue which impact the economic limit. Gas wells are usually more sensitive to market conditions than oil wells and differences also exist in maintenance requirements. High producing GORs increase the size and cost of gas-handling equipment, particularly compression. Heavy, waxy, and emulsified oils are more difficult to segregate from water, and require larger vessels with greater retention volume.
Lease operating cost factors estimated for various field configurations
Oil and gas lease operating cost in the US are estimated by Energy Information Administration staff engineers for a representative 10-well oil lease producing by artificial lift and a one-gas well lease.12 Operating costs in the Gulf of Mexico federal offshore are estimated for 12- and 18-well platforms producing primarily oil assumed to be 50, 100, and 125 miles from shore, corresponding to 100, 300, and 500 ft of water.
Staff engineers survey supply, service, and contracting companies each year for local June prices for their equipment costs or operating function. Individual items of equipment are priced using price lists and by communicating with the manufacturers or suppliers in each region. Operating costs measure the change in direct costs incident to production and exclude changes in indirect costs such as depreciation, ad valorem, and severance taxes.
Near the end of the producing life of a field, because of increased maintenance expense, scale and corrosion control, water production and treatment, and related factors, the operating cost will be greater than normal field operating cost.
End-of-life fields will normally be producing from one or two wells, and so a one-well lease is considered for comparison. We normalize the EIA operating cost data to a one-well oil lease producing by artificial lift, a one-well gas well gas lease, and a one-well platform in state waters.
Onshore oil production
Leases for oil wells in East Texas and Louisiana consist of 10 wells producing by artificial lift into a central tank battery. The depths of all wells on each lease are assumed to be 2,000, 4,000, 8,000 or 12,000 ft, and the dominant artificial lift method in each region for each depth was employed. Annual operating costs were estimated for daily production rates of 100 b/d/well of liquid for each depth with 10% water content (Tables 4 and 5). Secondary oil production cost for increased liquid lift and water injection was not considered.
Costs for secondary oil production in West Texas are calculated for leases assumed to have 10 producing wells, 11 injection wells, and 1 water supply well. Costs for storage tanks, injection plant and lines, and water injection wells are included. A liquid lift rate of 250 b/d/well of liquids producing 90 b/d of oil is assumed (Table 4).
Onshore gas production
Leases for gas wells were assumed to consist of one well producing into an onsite separator with a lease condensate sales tank and a water storage tank. Gas production rates of 50, 250, 500, 1,000, and 5,000 Mcfd and well depths from 2000 to 16,000 ft were used to account for the different processing requirements for each flow rate (Tables 6 and 7). Low flow rates were selected to identify production cost from stripper wells.
Offshore oil, gas output
Operating costs in the Gulf of Mexico were estimated for 12- and 18-slot platforms containing one dually completed well for each slot assumed to be 50 and 100 miles from shore (Table 8).
Maximum crude oil and associated gas production was assumed to total 11,000 b/d/platform of oil and 40 MMcfd/platform of gas. Meals, platform maintenance, helicopter and boat transportation of personnel and supplies, communication costs, insurance costs for platform and production equipment, and administrative expenses are included. Oil and gas transportation costs to shore and water disposal costs were excluded.
The EIA operating cost estimates are extrapolated to shallow (state) water categories 50, 25, and 10 ft using an assumed 90% cost reduction factor and an average 12-slot and 18-slot facility. The operating cost per well are computed by normalizing by the number of platform slots
Location
Location is important because differences in terrain, accessibility, and environmental conditions contribute to differences in development and operating cost which are expected to translate into differences in economic limits.
Texas is the second largest state in the US and has diverse topography throughout the state. The dominant physical feature of Louisiana is the Mississippi River, and much of the state's terrain is related to the Mississippi. Almost one fifth of Louisiana's total area of 51,843 sq miles is covered by water.
Coastal Louisiana is famous for its wetlands and delta lands; inland are rolling pine hills and prairies. To access sites in South Louisiana, canals are dug across wetlands in a process called channeling to create pathways (waterways) to move drilling and other equipment via barge or to build a road to the site. Both state and federal laws governing wetland development require that wetlands be conserved to the extent practicable and that the state obtain adequate mitigation for any impacts to vegetated wetlands.
In federal waters, the need for a robust platform structure, greater maintenance and transportation requirements, and higher insurance and communication cost contribute to higher operating cost than in state waters or onshore.
Oil premium
Oil has historically been priced at a premium to gas, trading on the spot market about one-and-a-half times the price of gas on a heat-equivalent basis since 1989 (Figs. 3 and 4).
Oil is usually priced at a premium because it is a globally traded commodity, many inexpensive options exist for transportation and storage, and its chemical constituents are a valued feedstock to the petrochemical and refining industry. In Fig. 5, the daily spot price trajectory delineates the premium.
Economic limit
Definition
The economic limit of a field is defined as the time when the net revenue of the field, NR(f, t), is equal to the field production cost, C(f, t):
Ta (f) = {t | NR(f, t) = C(f, t)}.Net revenue is defined as the gross revenue net of royalty. Production cost is defined to include operating cost, transportation cost, and production taxes13 (see Fig. 6).
Cash flow elements
Gross revenue is an observable quantity since operators are required to report oil and gas production for royalty and severance tax collection on a monthly basis and price data is publicly available at market hubs throughout each state. Adjustment for field quality (gravity, sulfur, heat content), however, is not easily performed and its spatial variation is often ignored.
Royalty rates are negotiable on private land but are not publicly disclosed and will vary with time and location, sometimes dramatically. On state-owned and federal lands, royalty rates are part of the public record.
Production cost is proprietary and cannot be reliably computed from a company's accounting and financial statements. Production taxes are based upon the state of a well's production at a given point in time and are readily computed; transportation cost algorithms to deliver product to market can be adopted if sales destination is known.
Determining economic limit formulation The time when net revenue is equal to production cost is determined from the relation: Ta(f) = {t| ∑ Pi (f, t)Q i (f, t)[1–ROY i (f)] = OPEX(f, t) + TRANS(f, t) + TAX(f, t)}, where Pi (f, t) denotes the average, quality-adjusted price of the field's hydrocarbon stream i (i = oil, gas, condensate) in year t, Q i (f, t) is the net production of field f in year t, and ROY i (f) is the royalty rate of stream i in year t determined as a fixed percentage of the gross revenues adjusted for the cost of gathering, compression, dehydration and sweetening. Capital expenditures and depreciation are usually negligible toward the end of the lifetime of a field, with operating expenses, OPEX(f, t), accounting for the bulk of the expenditures. Transportation costs, TRANS(f, t), are charged per unit of product, adjusted by a quality factor and distance to the processing facility; production (severance) tax, TAX(f, t), are imposed on the extraction of minerals and is most often a fixed percentage of production. |
Simplifying assumptions
To compute economic limits, a number of simplifying assumptions are required:
• First, royalty rates are not considered because the majority of state production occurs onshore on private lands where royalty rates are unobservable. Offshore, royalty rates can be included in the computations but would not be consistent with the onshore estimates.
• Second, we assume the spatial variation in price data and quality-adjustments are secondary effects; in the former case market data can be incorporated in the analysis but is believed to be a small impact; in the later case, difficulty arises in the requisite data collection.
• Third, we assume both transportation and production taxes are secondary impacts and can be ignored. For specific properties transportation and production may be important, but most often they are perceived to play a small relative contribution.
Economic limit relation
Under the above assumptions, the economic limit relation simplifies as:
∑ Pi(t)Qi(f,t)≈OPEX(f,t),which equates the operating cost of a field at the end of commercial operations to its last year gross revenue. Gross revenue is used to infer the economic limit of a field and when operations are no longer profitable. A field's last year of production represents a unique condition in its life cycle since only at this time does gross revenue serve to approximate field operating cost.
Revenue-production threshold
A field will cease production at its economic limit, and thus by observing fields that have terminated production, we can infer the revenue and production level when operations are no longer commercial. If the sample set is sufficiently large, we can correlate thresholds with field and site characteristics.
Terminated fields
Fields are geologic entities composed of one or more evaluation units (leases, wells, units, structures) owned by one or more working interest owners, and so fields are not assigned a status code to indicate when field production terminates.
This complicates the analysis since a field may go off-line for several years and then return to production without violating regulatory requirements. Thus, we need to identify fields that have terminated and not expected to resume production at a later date.
A field is defined as terminated if it has not produced any hydrocarbons for 5 or more continuous years. A field is said to terminate in year T if cumulative production for the 5-year horizon {T,…,T+4} is zero.
For fields that stopped producing between 2005 and 2008 we cannot, by definition, apply the same criteria since a 5-year horizon does not exist. We thus relax the criteria by which terminated fields are identified during this period so long as they did not produce through 2008. This is not as rigorous as requiring fields to cease production for 5 straight years, and there is a greater uncertainty associated with the identification of terminated fields during this time period.
End-of-life production, revenue
Let tlp denote the last year of production of field f. The gross revenue and production at time tlp, GR(f, tlp) and Q(f, tlp), is used to infer the operating cost of the field at abandonment.
The annual production and gross revenue streams are computed during the last year of production at t = tlp and 1, 2,…, k years before last production.
The production and gross revenue streams in the year of last production is referred to as the production and revenue "threshold" and denoted by Q* = Q(f, tlp) and R* = GR(f, tlp).
Average threshold
The average revenue and production the last k years of a field's life is denoted as Qk* (f) and Rk* (f). Unlike the last year of production, which indicates noncommercial operation, the k-average thresholds provide an indication of when revenue and production is approaching noncommercial status.
Expectations
Operations that occur offshore have greater operational cost because of greater logistical, maintenance, and pipeline transportation cost, and thus, higher economic limits are expected relative to land-based environments. Similarly, operations that occur in a coastal/marsh environment are expected to be more expensive than land-based operations.
We would expect gas production to be cheaper than oil operations because of smaller variable cost, but if the oil premium is a dominanting factor, then operators can produce oil at a lower threshold (and revenue) because of the premium; i.e., the economic limit of oil production may be less than gas operations.
Our intuition informs our expectations and is based on "average" behavior in both a statistical and operational sense:
1. Operating costs in federal waters are expected to be greater than state waters which are expected to be greater than operating in bays-estuaries or onshore;
2. Oil production cost is expected to be greater than gas production cost, but if the oil premium dominates gas revenue thresholds will be higher across state waters, bays, and land;
3. Oil/gas fields are expected to exhibit economic thresholds somewhere between oil and gas fields.
Uncertainty
We cannot control for factors such as the size and age of the field, production mechanism, operator type, or related factors, and so we expect standard deviations to be significant. Significant spreads indicate that other factors besides location and product type contribute to the variation observed.
The number of terminated fields forms the sample set from which the composite statistics are computed, and thus we need to be careful in our inferences if sample sizes are not sufficiently large to be representative of average conditions. In cases where sample sets are small, imputed statistics need to be interpreted with caution.
In subsequent parts of this series, we will test the above relations and compute economic limits in Texas, Louisiana, and the gulf OCS.
Next: Texas economic limits.
References
1. US Department of Energy, Energy Information Administration, "Crude oil production," Washington, DC, 2010 (http://tonto.eia.doe.gov/dnav/pet/pet_crd_crpdn_adc_mbbl_m.htm)
2. US Department of Energy, Energy Information Administration, "Natural gas gross withdrawals and production," Washington, DC, 2010 (http://tonto.eia.doe.gov/dnav/ng/ng_prod_sum_dcu_rusf_a.htm).
3. US Department of Energy, Energy Information Administration, "US crude oil, natural gas, and natural gas liquids proved reserves," Washington, DC, 2008 (http://www.eia.doe.gov/oil_gas/natural_gas/data_publications/crude_oil_natural_gas_reserves/cr.html).
4. US Department of the Interior, Minerals Management Service, "Annual summary of production for entire Gulf of Mexico region (2005-2010)," New Orleans, 2010 (http://www.gomr.mms.gov/homepg/pubinfo/repcat/product/pdf/Annual%20Production%202005%20-%202010.pdf).
5. Lowe, J.S., "Oil and gas law in a nutshell," 4th Ed., 2003, Thomson West, St. Paul.
6. Maxwell, R.C., Martin, P.H., and Kramer, B.M., "The law of oil and gas," 8th Ed., 2007, Foundation Press, New York.
7. Notice to Lessees No. 2008-N09, "Extension of lease and unit terms by production in paying quantities," Minerals Management Service, effective date Oct. 29, 2008.
8. McCain, J., "Petroleum fluids," 2nd Ed., 2001, PennWell, Tulsa.
9. "Field naming handbook," Minerals Management Service, New Orleans, 2006.
10. Seba, R.D., "Economics of worldwide petroleum production," 2nd Ed., 2003, Oil & Gas Consultants International and Petroskills Publications, Tulsa.
11. Puder, M.G., and Veil, J.A., "Options, methods, and costs for offsite commercial disposal of oil and gas exploration and production wastes," SPE Projects, Facilities, and Construction. December 2007, pp. 1-5.
12. US Department of Energy, Energy Information Administration, "Oil and gas lease equipment and operating costs 1998 through 2006," released June 18, 2007. Washington, DC (www.eia.doe.gov/oil_gas/natural_gas/data_publications/cost_indices_equipment).
13. Thompson, R.S., and Wright, J.D., "Oil property evaluation," Thompson-Wright Associates, Golden, Colo., 1984.
The authors
Azerbaijan
Azerbaijan International Operating Co. awarded a third contract extension to WGP Group, Bude, Cornwall, UK, for a life-of-field seismic survey at giant Azeri-Chirag-Guneshli oil field in the Caspian Sea off Azerbaijan.
For the Chirag Azeri Reservoir Seismic Project, WGP since 2007 has designed, installed, and operated a bespoke system capable of repeat all-azimuth ocean bottom cable seismic surveys that enable AIOC to monitor reservoir fluid movement.
WGP has performed three baseline and two repeat surveys, each with a total average spread of 540 sq km, between 2007 and 2009 with 195,000 total shots acquired. With sea trials successfully completed, Phase 2 of CARSP began in April 2010 and includes three new base lines and a repeat survey with an estimated 250,000 total shots.
BP PLC operates ACG field for 10 partner companies: BP, Chevron, SOCAR, INPEX, Statoil, ExxonMobil, TPAO, Devon Energy, ITOCHU, and Hess.
Mongolia
Manas Petroleum Corp., Baar, Switzerland, said the team of geologists and geophysicists at its DWM Petroleun unit in Ulan Bator has begun reinterpreting geological data and planning a gravity survey on blocks 13 and 14 in Mongolia.
The survey is to further define the layout of lines for a 300 line-km seismic program. An environmental protection and restoration plan has been prepared and is subject to ministry approval.
Data from 451 existing wells in Zuunbayan and Tsagaan Els oil fields and in the company's prospects have been collected and translated from Russian and Mongolian into English for analysis. The blocks cover nearly 5 million acres along Mongolia's southern border.
Newfoundland
Newfoundland's government Nalcor Energy encountered a hydrocarbon-bearing zone that warrants flow testing at Seamus-1, the first of three planned wildcats in the Anticosti basin onshore western Newfoundland.
The well reached a total depth of 3,160 m The zone is to be tested based on gas shows during drilling and geophysical log responses. The zone is behind casing.
Nalcor Energy didn't give a formation name or depth but said the "geological and geophysical prognosis of formation depths and stratigraphy anticipated from our prewell analysis proved to be accurate."
The well is to be tested later this summer with a service rig, allowing the rotary rig to move to the second site, Finnegan-1, expected to spud in June. The third location, Darcy-1, is to be drilled this fall.
The three wells, in the Parsons Pond area, are the first of this depth to be drilled in this part of the basin. Holding interests in the drilling program are Deer Lake Oil & Gas Inc., Investcan Energy Corp., Leprechaun Resources Ltd, and Vulcan Minerals Inc.
Other Canadian independents plan to drill four exploratory wells this summer on Anticosti Island farther west in the basin (OGJ Online, May 5, 2010).
More Oil & Gas Journal Current Issue Articles
More Oil & Gas Journal Archives Issue Articles
View Oil and Gas Articles on PennEnergy.com
