In-line EMAT expands IM capabilities
Based on presentation to NACE Corrosion 2009 conference, Atlanta, Mar. 22-26, 2009.
Electromagnetic transducer technology in-line inspections are sufficiently sensitive to detect crack-like features as part of pipeline integrity management. A multiparameter correlation process allows classification and characterization of crack-like features with acceptable probability. Detection, sizing, and characterization capabilities of the EMAT technology can provide the basis for subsequent application of integrity-management programs
Background
Gas and liquid pipeline operators are increasingly concerned aging pipelines may be subject to crack-like defects such as stress corrosion cracking and seam weld cracking. The US Office of Pipeline Safety issued an October 2003 advisory notice to all US pipeline owners and operators to evaluate their pipeline systems for the presence of risk factors associated with SCC (both high and near-neutral pH types). The advisory required operators to prioritize pipeline segments as high risk and develop an integrity-management plan to address potential threats if SCC and seam-weld defect conditions were found.
Integrity-management frameworks developed or already in place rely on in-line inspection data as a basis for the implemented strategies to mitigate and manage crack-like defects (SCC or seam-weld defects). The suitability of the selected technologies for particular integrity processes required proving by pull tests, field tests, and regular pipeline inspections.
This article provides insights into this process for the qualification of high-resolution EMAT technology on an intelligent in-line inspection tool.
Inspection technologies
The selection and qualification of a suitable inspection technology are part of the integrity-management development process. The operator chose a high-resolution EMAT in-line inspection tool in this case to address SCC and other possible forms of cracks in its gas pipelines. Literature addresses the basic concept of the high-resolution EMAT technology.1-3
This variety of in-line inspection tool typically consists of two measurement units equipped with a sufficient number of electromagnetic acoustic transducers to achieve complete coverage of the internal pipeline surface to be inspected (Fig. 1). High resolution allows addressing cracks and crack colonies with multiple channels, projecting the data set obtained onto the inner pipe-surface. EMAT response provides a detailed view of the dimensions and distribution of detected anomalies around the circumference and along the pipeline axis, supporting subsequent evaluation.
Liquid-coupled ultrasonic inspection technology has an established qualifying process. The technology's sensitivity to subcritical flaws and sufficient depth and length sizing capability justify its use instead of hydrostatic testing.4 A similar approach initiates the qualification process of EMAT technology for crack detection in gas pipelines.
Sensitivity
The sensitivity threshold for individual cracks accepted throughout the pipeline industry equals 30 mm (1.18 in.) length and 1 mm (0.039 in.) depth. Limit-state assessments of pipelines typically present larger dimensions as critical, arguing these dimensions for sub-critical flaws are overly conservative.4-6 A sensitivity analysis of EMAT technology meets the target for detecting sub-critical flaws.
ROSEN studied a combination of artificial and natural crack-like indications after introducing the EMAT tools to service,7 finding flaws 20 mm long and 0.65 mm deep with a probability-of-detection of 92%. EMAT detected crack-like anomalies 20 mm long and 0.42 mm deep with a POD of 44%.
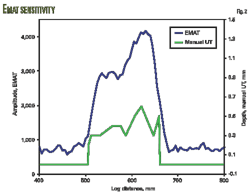
Increased defect length raises the likelihood of detecting shallower defects, as shown for a particular instance of mill-related surface breaking defect found during a pipeline survey. Fig. 2 shows data obtained during an excavation campaign following an EMAT survey, the depth profile derived from UT data taken manually in the ditch. The corresponding time integral of the EMAT amplitude shows a sufficient signal-to-noise ratio, illustrating the high sensitivity of the technology.
Depth sizing
API RP 5798 requires the depth calculated for an individual crack or cluster of cracks be classified into four different depth classes: <12.5% WT, 12.5-25% WT, 25-40% WT, and >40% WT. A later integrity assessment will add a safety factor and consider the upper boundary of each depth class for analysis.
The depth value given for a cluster is typically the deepest value found within the cluster. The crack depth reported as a part of an EMAT inspection follows the API categorization scheme. The sizing model developed on the electromagnetic acoustic inspection data uses a quantitative multiparameter correlation process. Various parameters derived from the data sets—e.g., amplitude and frequency content of different wave modes—are correlated to the depth of a crack indication. Development of the sizing algorithm used artificial crack-like defects as well as natural cracks and SCC.
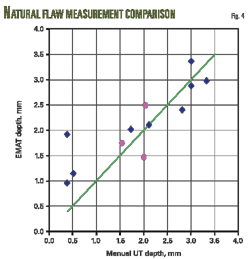
Figs. 3-4 show results of the sizing model for artificial and natural crack-like flaws respectively. Both present the scattering of the random error for the three defect populations. Accuracy in these examples measured ±0.64 mm with a confidence level of 90%. A systematic error exists between different pipe joints. An infield verification and pull-test program conducted on matching pipe samples addressed this error.
An electrodischarge machining technology created artificial flaws in 16 and 26-in. test joints. The natural defects lay in two joints of 16-in. and 24-in. OD. Accuracies achieved are similar to those found in established processes for crack evaluation with other inspection technologies.5 6
Length sizing
A threshold criterion used on the signal amplitude determines flaw length. Fig. 5 shows results from sizing artificial defects of different length and depth. Stable length sizing is possible for even short defects. The physical size of the applied shear wave, however, can cause a slightly larger scattering of length measurement for short features.
The length determination of cracks and crack fields is associated with clustering methods to find the fracture mechanical relevant total length. Magnetic particle inspection applied to a colony of cracks connected by superficial, shallow surface cracking (0.1-0.3 mm deep) would consider these cracks connected. Ultrasonic technologies, in general, respond only to flaws larger than the subcritical dimensions. Overcoming this situation requires a pattern analysis of the high-resolution data, taking the noise pattern of the reflection signal into account.
Clustering
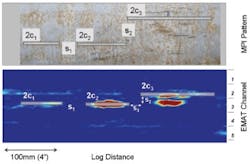
Fracture mechanics methods simplify identification of the crack path on the surface. A single crack model can, for instance, represent branch cracks, a well established methodology described in several different standards (e.g., API RP 579). This standard classifies cracks close to each other by their lengths (2ci) and their distances from each other (si). A subsequent step applies an interaction relation to classify the individual findings as interacting or noninteracting (see Equation box).
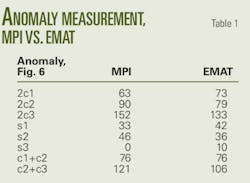
Such a clustering can apply to the lateral appearance of the crack colony visualized by MPI. Applying the clustering to EMAT data and MPI findings of the same area yields results of comparable quality (Fig. 6).
The upper part of the figure shows a photograph of MPI results of an SCC crack field in 16-in. OD pipe. The picture shows application of the clustering method for branched cracks according to API RP 579. The lower part of Fig. 6 applies the same process to EMAT data based on an automated length-sizing algorithm that uses threshold criteria. Table 1 summarizes the results. This calculation considers the three crack colonies as interacting, since the length of the colony is in every case larger than the minimum separation required for noninteraction.
Defect characterization
The detection sensitivity to a particular feature type is crucial in determining the suitability of an inspection technology. It is also imperative that the chosen inspection method be capable of identifying the particular defect type of a given feature. The classification process must use parameters allowing identification and categorization of crack-like features with acceptable probability.
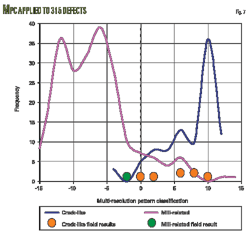
The classification process does not rely on a single parameter, instead applying a multiparameter correlation model accounting for the distribution of the response of the individual parameters to a particular feature type. The MPC parameter for crack-like features can be derived from and tested against other feature types.
Fig. 7 shows the results of such tests. Crack features should show an MPC >0, while noncrack features should have an MPC <0. The probability of identification achieved for the feature population in this example equaled 91% (Table 2).
Coating assessment
The condition of the external pipeline coating is valuable information in the integrity assessment process. Coating disbondment is a known precursor for stress corrosion cracking. Knowledge about a disbondment location combined with a crack indication in the survey data provides additional information more precisely locating any defects. Identifying the type of coating is also helpful, since some are more prone to SCC than others.9
The EMAT inspection system provides characteristics of both the coating type and the disbonded coating, deriving this information from the attenuation of the signal from the coating channel (transmission), which is independent from the crack channel (reflection). Fig. 8 details variation of the transmission amplitude as a function of different coating types. The differentiation between coal tar coating and fusion-bonded epoxy coating is reflected particularly well, supporting an integrity-related assessment.
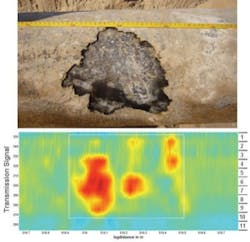
A change in transmission amplitude also identifies disbonded areas, reporting them as individual features (Fig. 9). Using multiple channels for localization of defects and disbondment allows detailed reporting of the lateral dimensions and position of the disbonded area.
References
1. Beuker, T., Alers, R., Brown, B., and Alers, G., "SCC Detection and Coating Disbondment Detection Using the High Resolution EMAT ILI-Technology," International Pipeline Conference, Calgary, Oct. 4-8, 2004.
2. Klann, M., and Beuker, T., "Pipeline Inspection with the High Resolution EMAT ILI-Tool: Report on Field Experience," International Pipeline Conference, Calgary, Sept. 25-29, 2006.
3. Damaschke, J., and Beuker, T., "First Surveys Run with Electromagnetic Acoustic Transducer," Pipeline & Gas Journal, Vol. 233, No. 10, October 2006.
4. Katz, D., Gao, M., Limon, S., and Krishnamurthy, R., "Advances In Crack Assessment For Pipeline Integrity," 11th International Conference of Fracture, Turin, Italy, Mar. 20-25, 2005.
5. Beller, M., Jung, T., and Reber, K., "Multi-Diameter and Quantitative Inspection Technologies for Offshore Pipelines," Pipeline Pigging Products and Services Association seminar, Aberdeen, Nov. 9, 2005.
6. "Crack Detection," GE document, CD_NA_071406, July 2006.
7. Doscher, C., "ECD Detection, Detection of Shallow Anomalies," ROSEN document, ECD_PA_003_1_1, June 2007.
8. API Recommended Practices 579, 1st Edition, January 2000.
9. Canada National Energy Board, "Report of the Inquiry concerning Stress Corrosion Cracking," December 1996.
The authors
Claus Doescher ([email protected]) is a physicist at the ROSEN Technology and Research Center, Lingen, Germany. He was a PhD student at the University of Hamburg from 2003 to 2006, working on quantum field theory on noncommutative space time. He holds a PhD from the University of Hamburg, received in 2006.
Thomas Beuker ([email protected]) is product line manager-inspection and testing at ROSEN Technology and Research Center, Lingen. Prior to product management he was manager of ROSEN's research and development physics department. His expertise is in data analysis and finite element modeling. He holds an MS from Muenster University, Muenster, Germany. He has been a member of the British Institute of Non-Destructive Testing since 1992.
More Oil & Gas Journal Current Issue Articles
More Oil & Gas Journal Archives Issue Articles
View Oil and Gas Articles on PennEnergy.com
