OGJ FOCUS: Rig-site equipment determines drilling fluid weight material sag
A series of experiments determined the equipment needed for finding the degree of sedimentation or sag in various drilling fluids at a rig site.
The design makes use of equipment already specified in other API procedures.
Sedimentation of weighting materials in drilling fluids affects both safety and operational efficiency during drilling and completion. With barite sag, gas kicks can occur easily.
The experiments used a wide variety of suspensions and demonstrated the potential for use of a simple direct-weight measurement for suspension stability.
The tests included several model suspensions with several solvents (water and oil) and solutes (barite and sand).
The equipment designed provides testing under string rotation and varied temperatures.
The implications of sag are so severe that the drilling industry through an API committee has initiated task forces for determining better ways for controlling sag.
Sag
Two-phase dispersions occur in a wide range of products such as foods, paints, and pharmaceuticals as well as during drilling of wells. For all these applications, particle sedimentation affects processing efficiency, end product quality, and product shelf life. The stability of drilling fluids is of particular interest because unstable drilling fluids can be a safety hazard and also degrade drilling efficiency.1
Drilling fluids are polydisperse emulsions and dispersions consisting of widely different components that interfere with each other. Particle aggregation, hydrodynamic, and electrostatic interference and the fact that there are billions of particles, all of various shapes and sizes, make it difficult to numerically model the fluids despite recent advances in computational technology. This complexity forces us to describe the weight material settling phenomenon by empirical modeling based on reliable experimental data.
The weighting agents used in drilling fluids are dense minerals such as barite, ilmenite, hematite, or manganese tetraoxide. These additives provide the necessary density to maintain the hydrostatic head needed to prevent the wellbore from collapsing and to hinder influx of gas, oil, or water into the wellbore. Keeping this material in suspension is therefore of utmost importance.
For detecting the degree of weight-material settling, called sag, the petroleum industry has applied techniques ranging from large-scale flow loops to specially designed viscometers with various inserts to promote settling.
Various references have thoroughly described these methods,2-4 and this article will not describe them further. It will, however, describe some less common alternative techniques that provide additional useful information about the sedimentation process that is not otherwise accessible.
A settling determination technique used within the food industry and in nuclear waste handling,5 uses ultrasonic sensing. This technique is based on the principle that the speed of sound depends on the material transmitting and reflecting the sound signal. For a suspension such as a drilling fluid, change in signal response makes it possible to determine particle shape, size, and concentration at different positions in the sample, including the degree of settling.
Because ultrasound may interfere with the gel structures in the drilling fluid and promote sag, it is, however, not clear to what degree this is useful as a general drilling fluid sag measurement tool.
The drilling industry has used nuclear magnetic resonance imaging for decades for formation logging. Rismanto and van der Zwaag6 have used this technique for sag measurements.
NMR imaging measures the resonant absorption of radio waves by selected atomic nuclei in the sample. The technique makes it possible to determine the density of hydrogen atoms in a fluid and hence by inference the solids content of, for example, density stratification in the sample cell for solids not containing significant hydrogen.
Saasen et al.7 used a device for density measurement consisting of a 2-m long annulus that allowed inner string motion. The annulus had 25 sample collection ports for removing samples for density measurements.
Lewis and Rasmussen used pressure sensors to determine particle concentrations and particle size distribution for soil sedimentation processes.
Nguyen et al.9 used a similar setup with pressure sensors at different positions in a flow-loop for studying barite sedimentation in oil-based drilling fluids and its dependence on drillstring rotation rate and wellbore inclination.
Not all of these techniques mentioned are suitable for field applications because of equipment size and complexity, while others show insufficient reproducibility or require specially trained staff to operate.
In the drilling industry, therefore, there is a need for an accurate device to determine a drilling fluid's settling potential.
The following describes the design of a simple device that uses direct weight measurement for sag determination.
Equipment design
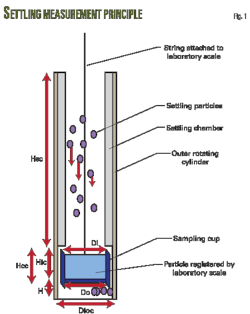
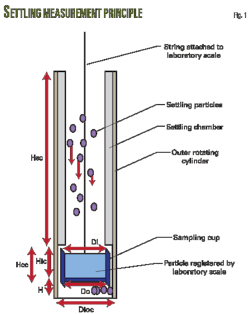
Our equipment consists of a settling chamber and a sampling cup that attaches to a laboratory scale with a steel rod (Fig. 1). The equipment registers solid material settling in the settling chamber only when the material hits the bottom of the sampling cup.
Using this simple principle and accounting for boundary conditions, we can determine some settling parameters that provide additional information of the settling process.
One of the boundary conditions needed is the area and volume of the sampling cup vs. the total volume of the settling chamber.
Design A (Fig. 2) has a sampling cup with a cross-sectional area equal to the area of the settling chamber (Di = Do). This implies the sampling cup collects most of the solid material in the settling chamber. Some material, however, will remain self-suspended due to Brownian motion and some may dissolve in the solvent (fluid). Because the laboratory scale will not register this material, there is some uncertainty in the weight reading.
Design B (Fig. 2) has a sampling cup with a much smaller base area than the settling chamber (Di<
The equipment used in our experiments (Fig. 3) consists of the laboratory scale coupled with a modified atmospheric consistometer, as described in API's well-cementing testing standard.10
The consistometer is standard equipment for the preparation of well cement slurries before rheological measurements or for determining thickening time. Using a consistometer as base for our equipment design, we benefit from having the option of using the outer rotating cylinder to provide the possibility for running sag tests at dynamic conditions, for example, with a simulated drillstring rotation.
The equipment is coupled to a cooling bath that makes it possible to run tests at both high and low temperatures.
The sampling cup has an ID (Di) of 50.2 mm and inner height (Hic) of 49.6 mm, giving it a 98.2-ml volume. The first step inserts the cup into the consistometer before the mounting of the settling chamber. A small gap between the settling chamber and the sampling cup allows the sampling cup to hang freely in the suspension to be tested.
The sampling cup has a 56-mm outer height (Hoc) and a 60-mm OD (Do). It is attached to the laboratory scale with a 6-mm steel rod. There is a 4-6 mm gap (H) between the bottom of the sampling cup and the settling chamber. This allows for a specific amount of material to settle before solids buildup underneath the sampling cup affects the weight (Fig. 4).
The ID of the outer rotating cylinder (Dioc) is 67 mm. This leaves a volume of about 34 ml in the annulus between the sampling cup and the outer rotating cylinder. In addition, the volume underneath the sampling cup is about 19 ml.
The bulk densities of loosely packed sand and barite used in our experiments were measured to be ~1.97 and ~2.37 g/cc, respectively.
From this it follows that for tests with sand, the maximum capacity of the sampling cup is ~194 g, while the sampling cup can collect 233 g of barite before being overfilled.
Buoyancy effects
If one adds particles to the fluid after equipment assembly, as is the case for the experiments described in the article, we only need to account for the buoyancy effect from the fluid density. This assumes that the bulk volume of particles added is less than the sampling cup volume.
If one lowers the sampling cup into a particle-laden fluid, the particles present in the fluid surrounding the sampling cup affect the weight readings. This implies that, as settling occurs in the annulus between the sampling cup and underneath the sampling cup, buoyancy changes.
Fig. 4 describes this phenomenon. Particles settling underneath the sampling cup reduce the bulk density of this volume and thereby reduce buoyancy and increase registered weight.
Similarly, if the bulk volume of the settling material exceeds the sampling cup volume, some material will settle in the annulus between the sampling cup and settling chamber's wall. This leads to increased buoyancy from the suspension in the annulus and thereby a lower weight reading.
In addition, particles settling out of the suspension underneath the sampling cup will lead to a lower bulk density of the suspension surrounding it. This will in turn lead to less buoyancy and thereby higher weight readings.
For tests in which one adds solids-laden fluids after equipment assembly, one needs to consider these elements. For optimization studies in which the particle content is equal, the described design is still valid.
Settling parameters
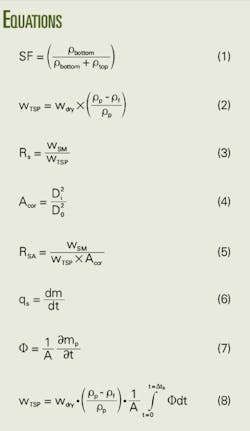
Several practical measures of sag in drilling fluids have been proposed. Swanson et al. describes one of the most commonly used measures that is based on the density difference between the top (ρtop) and bottom layer (ρbottom) of a fluid column.11 The difference defines a sag factor SF, Equation 1 in the equation box.
A sag factor of 0.5 thus corresponds to a nonsagging fluid, while values above some threshold identify potential operational problems. Other measures of sag also use the density variation to identify a settling process as a significant sag incident.12 13 The density differences alone, however, are not sufficient to predict sag incidents reliably.
For some operations one can still operate successfully with higher density differences than the set threshold value, while other operations require much smaller variations than specified. Furthermore, these measurements do not consider the dynamics in the system such as syneresis effects, for example, the displacement of free fluid to the top of the fluid column.
The equipment we developed allows for determining additional parameters that provide a more general and detailed description of the physics involved in the settling process. This includes the determination of parameters such as total settling potential, settling velocity or rate, and solid flux.
Settling potential
For all types of settling testing, the mass of the total solid material content in a sample normally follows from the fluid composition. For particles settling in a fluid, Archimedes' principle applies: A body fully or partially submerged in a fluid is buoyed by a force equal to the weight of the fluid displaced.
With a known quantity of dry material, Equation 2 calculates the total settling potential (wTSP), where wdry is the dry weight of the material, ρp is the particle density, and ρf is the density of the fluid suspending the solid material.
Equation 2 defines the settling potential, RS, as a ratio the mass of settled material in the test (wSM) to the total mass of material in the sample (wTSP) given from the fluid composition.
For field applications, measurement of this parameter can be relevant if the well construction limitations are given and one can determine an acceptable settling potential, based on the available operational window.
The calculation requires a correction factor, Acor (Equation 4), when a sampling cup does not cover the entire bore (area) of the settling chamber (Design B in Fig. 1). Di is the sampling cup's diameter, and Do is the inner diameter of the settling chamber.
Equation 5 applies to a correction of the settling potential.
Settling mass rate, flux
The time derivative of the settling curve provides directly the settling mass rate, qs (Equation 6). In the equation, m is the mass of settled material.
Fig. 5 shows a settling curve determined from a test that used our equipment. In this case, Di equals Do (Design A in Fig.1) and implies that the sampling cup collects almost all settled material and one can read the total settling potential, wTSP, directly from the settling curve.
We define time of breakthrough (tb) when qs = 0, such as when the mass of material entering the sampling cup equals the mass of material leaving it. In addition, we now obtain wTSP and it should equal the calculated values given by Equation 2, provided that the sampling cup volume exceeds the bulk volume of particles in the suspension and hence that no material settles outside the sampling cup.
The term "solid flux" expresses the amount of material passing through a selected area during a specified time period (g/(m2-sec)). This provides a more universal expression that also includes the area correction.
From Fig. 1, it is clear that the solid flux is inversely proportional to the base area of the inner cylinder and is then given by Equation 7, in which mp is the mass of settled material and A is the cross-sectional area where the particles pass through.
A combination of Equations 2 and 7 gives the total settling potential (Equation 8).
In this manner, we have established a system independent of test device design that is more applicable than the currently used sag definitions previously described.
Validation
To validate the performance of our equipment, we carried out numerous experiments with well defined model suspensions. The initial two tests used 149.5 g of barite at a 4.2 g/cc and an average 15-μm particle size (D50).
The first test involved pouring 400 ml of oil (ρf = 0.81 g/cc) into the test chamber and then adding barite. The second test was similar but used water (ρf = 1.0 g/cc) in the settling chamber before the barite addition.
These additions of particles to two fluids should, according to Equation 1, give final readings of 121.0 g and 113.9 g, respectively.
Fig. 6 shows that the first test with barite added to oil gave a final reading of 117.4 g, while the test with barite added to water resulted in a 107.6-g reading. This resulted in an error of 2.9% and 5.5%, respectively.
The test with water in the settling chamber also obtained stable readings of ~7 g after 48-50 min before it increased to 107.6 g. This probably was caused by the high sensitivity of the laboratory scale that registers nearby movements.
At the end of the test period, the weight was increasing slightly, and we also observed some material settling outside the sampling cup, causing the discrepancy between the calculated and measured values. Furthermore, we observed some particles still to be dispersed in the fluid at the end of the test. These tests, however, show that the equipment will measure the sedimentation rate adequately with a reasonable accuracy.
Fig. 7 shows the solid flux for these tests (Equation 7) using a sampling cup with an ID Di = 50.2 mm. As observed from the figure, the solid flux is higher for particles settling in oil than in water.
Fig. 8 shows the results of similar experiments as in Figs. 6 and 7 but using sand (Bascarp 10 delivered by Askania AS) with a known particle size distribution added to 350 ml of water (ρf = 1.0 g/cc). The density of the sand was 2.6 g/cc with an average particle size, D50, of 114 μm.
Two tests were run during a short period, both having 400 ml of water in the settling chamber before particle additions. The first test added 50 g of sand to 400 ml of water. The second test had two steps: first 16.5 g added before an additional 33 g, which should, according to Equation 2 result in readings of 10.1 g and 30.4 g, respectively.
For these experiments, the first test showed an uncertainty of 0.9 %, while the two-step test ended up with uncertainties of 2.0% and 5.2% for each step of the test. In each test, we again observed that the fluid still suspened some material at the end of the test, explaining the discrepancy between calculated and measured values.
References
1. Saasen, A., et al. "Drilling HT/HP Wells Using a Cesium Formate Based Drilling Fluid," Paper No. IADC/SPE 74541, IADC/SPE Drilling Conference, Dallas, Feb. 26-28, 2002.
2. Schlemmer, R.P., et al., "A Comparison of Sag Measurement Methods and Implications for Additive Performance and Selection," Paper No. AADE-03-NTCE-57, National Technolgy Conference, Houston, Apr. 1-3, 2003.
3. Mullen, G., et al., "Coupling of Technologies for Concurrent ECD and Barite Sag Management," Paper No. AADE-03-NTCE-29, National Technology Conference, Houston, Apr. 1-3, 2003.
4. Zamora, M., and Bell, R., "Improved Wellsite Test for Monitoring Sag," Paper No. AADE-04-DF-HO-19, AADE Drilling Fluid Conference, Houston, Apr. 6-7, 2004.
5. Bamberger, J.A., and Greenwood, M.S., "Using ultrasonic attenuation to monitor slurry mixing in real time," Ultrasonics, Vol. 42, 2004, pp. 145-148.
6. Rismanto, R., and Van der Zwaag, C., Explorative Study of NMR Drilling Fluid Measurement," Annual Transactions Nordic Rheology Society, Vol. 15, 2007.
7. Saasen, A., et al., "Prediction of Barite Sag Potential of Drilling Fluids from Rheological Measurements," Paper No. IADC/SPE 29410, IADC/SPE Drilling Conference, Amsterdam, Feb. 28-Mar. 2, 1995.
8. Lewis, A.J., and Rasmussen, T.C.: "Determination of Suspended Sediment Concentrations and Particle Size Distributions Using Pressure Measurements," Journal of Environmental Quality, Vol. 28, 1999, pp 1490-96.
9. Nguyen, T.C., et al., "Combined Effects of Eccentricity and Pipe Rotation on Dynamic Barite Sag—Analysis of the Different Impacts of Pipe Rotation in a Flow Loop & Rotation in a Modified Rotational Viscometer on Barite Sag," AADE National Technical Conference & Exhibition, New Orleans, Mar. 31-Apr.2, 2009.
10. Specification for Materials and Testing for Well Cements, API Spec. 10 (5th edition), Washington: American Petroleum Institute, 1990.
11. Swanson, B.W, et al., "Application of Novel Technologies in the Design and Engineering of Synthetic-Based Mud Used to Drill and Complete Horizontal, High-Temperature/High-Pressure Wells in the Central North Sea, Marnock Field," Paper No. IADC/SPE 59187, IADC/SPE Drilling Conference, New Orleans, Feb. 23-25, 2000.
12. Tehrani, A., et al., "Role of Rheology in Barite Sag in SBM and OBM," Paper No. AADE-04-DF-HO-22. AADE Drilling Fluid Conference, Houston, Apr. 6-7, 2004.
13. Hemphill, T., and Rojas, J.C., "Improved Prediction of Barite Sag Using a Fluid Dynamics Approach," Paper No. AADE-04-DF-HO-20AADE Drilling Fluid Conference, Houston, Apr. 6-7, 2004.
The authors
Helge Hodne is an associate professor at the University of Stavanger. Hodne holds a PhD in well cementing from the same university.
More Oil & Gas Journal Current Issue Articles
More Oil & Gas Journal Archives Issue Articles
View Oil and Gas Articles on PennEnergy.com
