Special Report: CFD techniques determine gas-lift valve behavior
A novel approach using computational fluid dynamics techniques provides a way for determining the characteristics of gas passing through a gas-lift valve.
In the method, CFD calculations numerically solve the governing equations for a flowing fluid. To facilitate the simultaneous solution of the governing equations, the procedure involves dividing the flow space (the inside of the valve available for gas flow) into sufficiently small finite volumes or cells. The accuracy of flow modeling greatly depends on the proper setup of these cells. This article describes this spatial distribution.
After one properly sets up the cell structure in the gas-lift valve’s inside gas passage path, CFD calculations can determine the gas volumes passed by the valve under static conditions for different combinations of valve stem travel, injection, and production pressures.
In dynamic conditions, however, valve stem travel is a function of the net opening force on the valve stem tip. The authors developed an iterative procedure to describe this valve behavior that finds this force by integrating the pressure distribution on the valve stem tip,
The result of the proposed model is the dynamic performance curve of the gas-lift valve from which one can obtain the injected gas rate vs. injection, production, and dome charge pressures.
The procedure developed results in gas injection rates close to those determined from the API RP11V2 model.
Characterizing valves
Although gas passage characteristics of gas-lift valves are important, the industry did not investigate the problem in depth for many years. In the past, the static force balance equations and the assumption that valves while open behave as square-edged orifices described the performance of gas-lift valves.
This characterization assumed that the valve quickly and fully opened as soon as the injection and production pressures satisfied the opening conditions.
When the valve was fully open, the basis of the gas flow rate calculations was the valve’s port size and the equation originally proposed by the Thornhill-Craver Co., which is valid for flow of ideal gases through fixed orifices.
Gas-lift valves, however, do not provide a constant flow area because the valve stem rarely lifts completely off the seat. The position of the stem, in relation to the valve seat is a function of the pressure conditions; therefore, the valve acts as a variable orifice.
One of the first papers investigating this problem states that the gas-lift valve tested (a Camco R-20) behaved as a variable-orifice Venturi device and not as a simple orifice.1 A Venturi device is a converging-diverging nozzle in which the minimum flowing pressure occurs at its throat and there is a considerable pressure recovery downstream of the throat. The cross-sectional area of the throat changes with the position of the valve stem which, in turn, varies with changes in the injection or production pressures.
In conclusion, the pressure acting on the valve stem tip never equals injection pressure, as suggested from the static-force balance equations.
L.A. Decker, who laid the foundation for present-day valve testing procedures, did the first practical investigation on the dynamic performance of gas charged bellows valves.2 He derived the formulas to describe the behavior of the bellows assembly and introduced the concept of the bellows load rate.
His analytical model allows one to determine the valve stem’s position as a function of the mean effective pressure acting on the bellows area.
The spring-loaded valve without bellows charge was the first valve experimentally investigated for its gas passage behavior. In normal operation, this valve never opens fully and the pressure upstream of the port is very close to production pressure both in open and closed positions. The original manufacturer, Merla Tool Corp., realized the need for flow capacity data on such throttling valves and performed hundreds of flow tests, starting in the early 1960s, and made the results available to the industry.3 4
Research into the dynamic behavior of gas-lift valves received a new impetus in the late 1980s after the founding of the Tulsa University artificial lift projects (TUALP), an industry-sponsored research consortium. It published several papers covering the main results of many years of experimental work.5-8
Gas passage through gas-lift valves can occur under two different flow patterns: orifice and throttling flow. Orifice flow is similar to gas flow through a fixed choke, whereas throttling flow resembles flow through a variable-area Venturi device.
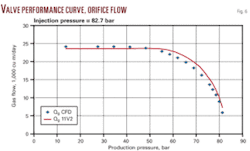
The orifice flow model occurs with the valve stem at its maximum travel when the valve port behaves as a fixed orifice. For a constant injection pressure, decreasing production pressures entail an increase in the gas rate until reaching critical conditions. Upon further decrease in production pressure, the injection rate remains at its critical value.
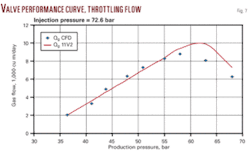
In throttling flow if production pressure decreases below the injection pressure, the gas rate increases due to the increasing pressure differential across the valve seat. After reaching a maximum value, injection rate linearly decreases with production pressure until gas flow ceases at the closing production pressure.
Mainly based on the systematic work performed at TUALP, API published the first edition of Gas Lift Valve Performance Testing (API RP11V2) in 1995.9 It covers recommendations on the proper measurement and testing procedures for gas-lift valves and contains a calculation model for determining gas throughput capacities of valves.
The Valve Performance Clearinghouse, a joint industry project founded in 1996, used a closely related procedure to provide experimental performance data on gas-lift valves for the industry.
Basic flow equations
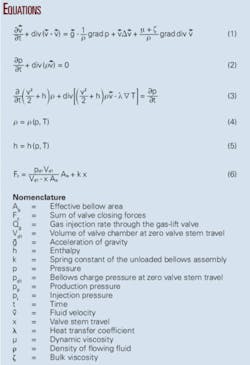
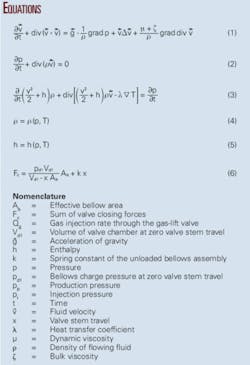
The Navier-Stokes equation representing Newton’s second axiom characterizes gas flow inside of a gas-lift valve (Equation 1 in the accompanying equation box).
The continuity equation, Equation 2, describes the conservation of mass, while Equation 3 expresses the conservation of the energy of the flowing fluid.
Because these three basic differential equations governing the flow conditions have five unknowns, an unambiguous solution requires two more equations. These are the equation of state for the flowing fluid and the equation describing the change of the enthalpy with the state parameters (Equations 4 and 5).
The five equations constitute a system of equations with five unknowns, making the simultaneous solution of them theoretically possible.
Numerical solution
Because an analytical solution of the basic flow equations (Equations 1-5) is possible only for very simple cases, complex cases usually require numerical solutions, so-called finite element models.
The computational fluid dynamics program package used in this article performs a numerical solution of the governing equations using finite volumes. The program constructs these by dividing the flow space into a finite number of cells with finite volumes connected to each other.
It makes calculations at the geometrical centers of the cells (the node points) and first calculates the fluid and flow parameters. Then it solves the algebraic equations resulting from the integration of the basic differential equations at cell boundaries to obtain the five unknowns at the node points.
Geometrical flow space model
Results of CFD calculations depend on the proper setup for the geometrical model of the flow space because improper models can cause convergence difficulties and erroneous results. In our case, the geometrical model means the representation of the internal space of the gas-lift valve where gas flow takes place.
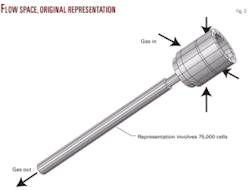
Fig. 1 shows the part of the valve investigated. The space available for gas flow constitutes the flow space for the CFD calculations. The calculations require the filling of this space with interconnected hexahedrons representing the cells.
Ensuring higher accuracies and faster solutions requires selection of the hexahedrons that are nearly cubes.
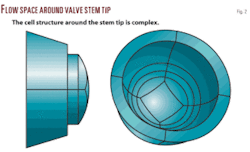
The most important part of the flow space is around the valve stem tip for two reasons:
- The geometry in this area is the most complicated, involving the valve ball that is difficult to approximate with hexahedrons.
- Proper knowledge of pressure distribution on the valve stem tip is essential for calculating the forces acting on the valve stem.
Fig. 2 displays cell structure details at this critical part of the flow space.
The remaining parts of the flow space have a tube shape below the valve port and form an annulus above the valve port. These are easier to represent than the region around the valve stem tip. Finally, Fig. 3 shows an approximation of the total flow space of the gas-lift valve.
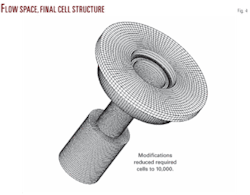
The cell structure in Fig. 3 involves 75,000 cells. Because this large number of cells led to an excessive CFD program run time, the authors investigated the possibility of simplifying the flow geometry. To reduce the cell number while sustaining calculation accuracy, the analysis tried two simplifying modifications as follows:
- Replacing the four gas inlet ports by one of the same total cross-sectional area.
- Trimming the two ends of the flow space by decreasing the length of the tube-like shape downstream of the valve port and the annulus upstream of the valve port.
These modifications reduced the required cells to about 10,000. Fig. 4 displays the final cell structure.
Computational time with the new flow space configuration was about one tenth of the original run times.
To ensure that the reduced cell number did not sacrifice calculation accuracy, the analysis included a set of control calculations. Comparisons of the results of pressure distributions along the flow path showed negligible differences, justifying the use of the simplified flow space configuration.
Simulation results
The analysis applied the theoretical and practical considerations detailed so far to determine the gas throughput capacity of a 1 in. OD, Camco BK-1 type gas-lift valve with a 3/16-in. port.
Simulations of gas-lift valve behavior consisted of the following main tasks:
- First, the simulation assumed a valve stem’s travel measured from the valve’s closed position.
- It then constructed the flow space using carefully measured dimensions of the disassembled valve.
- Next, the simulation assumed values for the prevailing bellows charge, injection, and production pressures.
- The CFD program solved the governing equations (Equations 1-5) and calculated the spatial distributions of pressure, velocity, and temperature.
CFD calculation results determined the following two important operational parameters of the gas-lift valve under the assumed conditions:
- The net vertical force acting on the valve stem.
- The gas flow rate across the gas-lift valve.
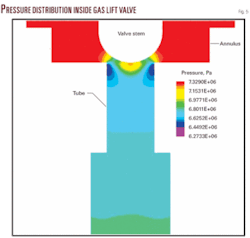
Fig. 5 shows the pressure distribution inside the valve for an example case.
Valve performance curves
The valve performance curve describes the dynamic performance of the gas-lift valve and presents the valve’s gas throughput capacity for different injection and production pressures at a given bellows charge pressure.
As previously mentioned, gas-lift valves can have two main kinds of behavior: orifice flow or throttling flow. Orifice flow occurs when valve stem travel is at its maximum and the valve behaves like a simple orifice. Throttling flow, on the other hand, occurs at smaller stem travels when the valve behaves as a variable-orifice Venturi device with a restricted gas-injection capacity.
It follows from the nature of the two possible flow conditions that CFD calculations easily simulate orifice flow. This is due to the fact that the valve stem is always at its maximum upward position so that the simulation run easily finds the gas rates. One simulation, therefore, can provide the valve performance curve for orifice flow.
Throttling flow, however, is more complicated to describe because the valve stem assumes its equilibrium position as the result of the different forces acting on the stem. These forces come from the dome charge and the injection pressures acting on their respective surfaces in addition to the net force acting on the valve stem’s tip.
Because CFD calculations require the knowledge of the actual valve stem travel to calculate the pressure distribution and consequently the net force arising on the stem’s tip, deriving the valve’s performance curve requires an iterative procedure.
The analysis bases the iterative solution on the fact that at equilibrium conditions the sum of the forces acting on the valve stem is zero. The four forces involved are:
- Dome charge pressure acting on the full bellows area.
- Spring force arising in the metal bellows.
- Net force acting on the valve stem’s tip.
- Injection pressure acting on the difference of the bellows and port areas.
The sum of the two first forces, as calculated in Equation 6, tries to close the valve. The equation properly considers both the increase in dome charge pressure due to compression of the bellows and the increase of spring force due to the increase of valve travel.
The two latter forces try to open the valve. CFD calculations using the injection pressure easily determine these forces. By setting the opening and closing forces equal, the calculation finds the valve’s actual stem travel. This is the principle of the iterative procedure.
Using the procedure detailed, one can easily develop valve performance curves for any gas-lift valve under conditions.
Figs. 6 and 7 are two sample curves for a Camco BK-1 valve with a 3/16-in. port and a dome charge pressure of 67 bar. Both figures present gas injection rates calculated from CFD simulations as well as those found from the API RP11V2 model.9
Fig. 6 involves orifice flow with an injection pressure of 82.7 bar, while Fig. 7 shows the valve performing in the throttling region at an injection pressure of 72.6 bar.
References
- Neely, A.B., et al., “A Field Test and Analytical Study of Intermittent Gas Lift,” SPE Journal, October 1974, pp. 502-12.
- Decker, L.A., “Analytical Methods for Determining Pressure Response of Bellows Operated Valves,” Paper No. SPE 6215, unpublished, 1976.
- Orris, P.W., et al., Practical Gas Lift, Merla Tool Corp., Garland, Tex., 1963.
- Decker, K.L., “Computer Modeling of Gas-Lift Valve Performance,” Paper No. OTC 5246 OTC, Houston, May 5-8, 1986.
- Acuna, H.G., et al., “Modeling of Gas Rates through 1-in., Nitrogen-Charged Gas-Lift Valves.” Paper No. SPE 24839, SPE ATCE, Washington, Oct. 4-7, 1992.
- Sagar, R.K., et al., “A Mechanistic Model of a Nitrogen-Charged, Pressure Operated Gas Lift Valve,” Paper No. SPE 24838, SPE ATCE, Washington, Oct. 4-7, 1992.
- Nieberding, M.A., et al., “Normalization of Nitrogen-Loaded Gas-Lift Valve Performance Data,” SPE Production & Facilities, August 1993, pp. 203-10.
- Hepguler, G., et al., “Dynamic Model of Gas-Lift Valve Performance,” JPT, June 1993, pp. 576-83.
- Recommended Practice for Gas-Lift Valve Performance Testing, API RP11V2, 1st Edition, January 1995.
The authors
Zoltan Turzo is an associate professor in the petroleum engineering department at the University of Miskolc, Hungary. His expertise includes artificial lift, pipeline hydraulics, computational fluid dynamics, and software development in production systems and pipeline networking. Turzo holds an MS and PhD in petroleum engineering from the University of Miskolc.
Gabor Takacs ([email protected]) is a professor and acting director of the petroleum engineering department at the Petroleum Institute in Abu Dhabi. Previously he was head of the petroleum engineering department at the University of Miskolc. Takacs has more than 30 years of teaching and consulting experience in production engineering and has been a visiting professor at Texas Tech University and the Mining University of Leoben, Austria. He holds an MS and a PhD in petroleum engineering from the University of Miskolc.
