Trend surface residual anomaly mapping and well data may be underutilized combo

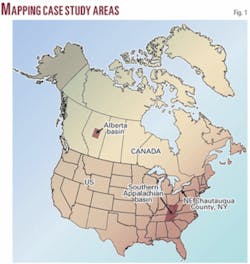
Trend surface residual anomaly (TSRA) mapping techniques have been applied to three regions (Fig. 1) to demonstrate their use in the identification of blind structures and trends in areas with substantial well data and limited seismic data.
TSRA mapping is a fast, simple, and inexpensive technique that is capable of detecting individual faults, fault-related structures, structural trends, reef complexes, and sole horizons. It is commonly difficult to delineate these features in a standard structure contour map because they are masked by regional dip. Blind thrusts, decollements, and reefs are challenging to identify and delineate because of the inherent lack of surface information.
Typical exploration involves correlating available seismic and well data in conjunction with potential field and lineament data, but extrapolating trends or structures usually involves gathering more data or drilling. Decollements are especially difficult to identify in seismic and borehole data because the fault surface is parallel to bedding without marker offsets. Only when a decollement ramps up-section or splays can it be more easily identified, yet the associated structures will be localized and decrease up-section.1-4
Trend surface analysis is a traditional technique that has long been used by geologists for the analysis of geological data,5 6 approximation of regional dip,7-9 and general subsurface exploration.9 The technique represents a methodology for approximating observed data, and serves as a graphical representation of the regression surface.
Trend surface and TSRA mapping have long been used in potential field mapping and modeling, but application of this technique to well data is uncommon. Well data are customarily presented as structure contour and isopach maps, along with well-to-well correlations.
In essentially flat-lying stratigraphy, low-amplitude targets may be impossible to properly identify using standard maps.3 TSRA mapping, however, has been shown to detect or delineate individual fault(s), structures, structural trends, reef structures, and sole horizon(s).3 4 9
Trend surface analysis may also be incorrectly associated with surface fitting because of the shared methodology. Surface fitting is an attempt to ultimately mimic the observed data as best as possible. In this approach, residual values are assumed to represent undesirable errors or noise10 and are filtered out. This article, however, uses trend surface analysis to enhance and utilize residual data.
Methodology
Trend surfaces are made by fitting a generated surface to the structure contour data using a regression matrix.9 TSRA values are derived by subtracting the generated data (trend surface data) from the observed data (structure contour data).
First- and second-order residuals are commonly used in areas with small horizontal extent and horizontal stratigraphy or in larger areas with limited data. Third-order or higher residuals are usually used in regional mapping.
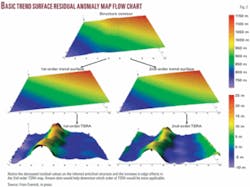
The order of the trend surface is mainly dependent on correlations of known fault displacements or reef thicknesses with the residual anomaly values, but also to the amount of data and data spacing. In general, the less data or data coverage will require a lower order trend surface because higher-order trend surfaces will increase the amount of edge effects and contouring errors (Fig. 2).
Statistical tests may not be appropriate guides for the selection of degree of the residual anomalies because the targets are ultimately qualitatively chosen based on geologic correlations and not by “goodness of fit.”9 11 TSRA values below known displacements or thicknesses are undesirable and may negate the resulting map. A lower-order trend surface should be utilized until the generated values are slightly above observed or estimated fault displacements or reef thicknesses.
For example, a fault with 10 m of offset, identified in a geophysical well log, should ideally match the TSRA value or be slightly larger than the measured displacement. Therefore, if a TSRA value derived from a first-order trend surface was 12 m, then the map would be acceptable. If a second-order TSRA value was calculated to be 7 m, the map should be disregarded because the TSRA value was less than known fault displacement. Ideally multiple observed values should be used to tie the residual values and observed data.
This illustrates the subjective and iterative nature of TSRA mapping. However, statistical tests and knowledge of the regional geology can help minimize misinterpretations. After a TSRA map has been generated, it may be possible to identify potential structures or trends, but further in-depth well log correlations and seismic reflection data can then be used to define the detailed characteristics and possible origin of the feature.
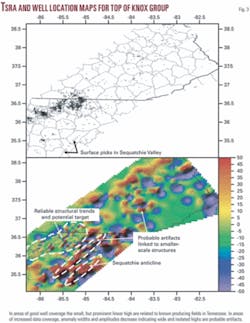
It is also possible to create TSRA maps by creating synthetic datasets from digitizing paper structure contour maps. TSRA mapping does not have the ability to extrapolate or identify structures in areas with poor well coverage or in large data gaps.9 Trends in these areas may be spatially-aliased edge effects or contouring artifacts (Fig. 3).4
TSRA maps, therefore, may be of limited use in exploratory areas with little well data. The implementation of this technique in mature basins or fields with large amounts of well data, however, could identify unknown or better delineate known petroleum traps that may below seismic resolution.
Case studies
Three case studies are presented that illustrate the varied uses of TSRA mapping in the Appalachian and Alberta basins.
Each region has a different tectonic setting and targeted geological feature, but they are approached using the same methodology. The order of the trend surfaces was based on known and estimated fault displacements or reef thicknesses. All interpretations were based on the understanding of the regional geology and stratigraphic architecture.
The targeted features were the Rome trough in the southern Appalachian basin, the Chautauqua anticline and a decollement in the northern Appalachian basin, and Devonian reef complexes in the Alberta basin.
Chautauqua anticline
The Chautauqua anticline (also known as the Bass Islands structural trend) in western New York is associated with small-displacement thrust faults splaying off the termination of a blind decollement soled in Silurian Salina Group salts.2 3 12 13
The anticline has been extensively drilled for hydrocarbons for over 30 years and therefore serves as an ideal case study. It is difficult to delineate the structure using standard structure contour maps, but it is clearly identifiable in a TSRA map (Fig. 4). This open anticline has a limited surface expression3 14 but tightens down-section.
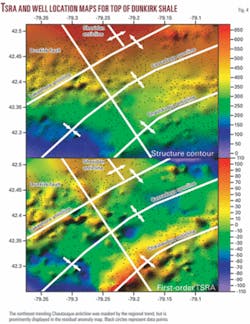
The horizons chosen to illustrate this structure were the Dunkirk shale (Upper Devonian), Onondaga limestone (Middle Devonian), and Medina formation (Lower Silurian). Each horizon is separated by 1,000 ft (Fig. 5). The upper two horizons are above the decollement and delineate the Chautauqua anticline along with other structures.
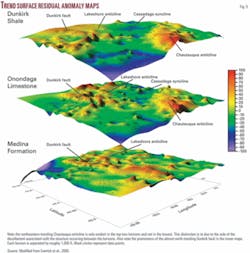
The northwestern shift in the anticlines signature on the TSRA maps from the Onondaga limestone to the Dunkirk shale denotes the structure has a northwest vergence. In the Medina formation TSRA map the Chautauqua anticline is no long identifiable because the horizon is situated below the detachment. Hence, to bracket or validate the sole of a decollement, one must generate maps above and below the sole horizon in order to properly identify the changing deformational patterns.
Other structures are also revealed in the TSRA maps. Notice that the Lakeshore anticline is still evident in the Medina formation TSRA map. The Medina formation is below the inferred master detachment, so this structure is probably associated with another unknown feature (i.e., a deeper decollement or basement structure).
Also, the NNW-SSE feature, increasingly evident in the lower horizons, is associated with the Dunkirk fault. It is interpreted as a reactivated basement fault.3 The Sheridan anticline may also be related to the Dunkirk fault as they are parallel and the anticline is on the inferred hanging wall.
Rome trough
The Rome trough is a northeast-trending aulacogen related to Iapetian rifting during the Cambrian.
In eastern Kentucky, the Rome trough (Fig. 6) is bounded on the west by the Lexington fault system, on the north by the Kentucky River fault system, and on the south by the Rockcastle River fault system.15-17 The trough extends from New York to Tennessee but is poorly delineated near its distal ends due to limited data.14 18
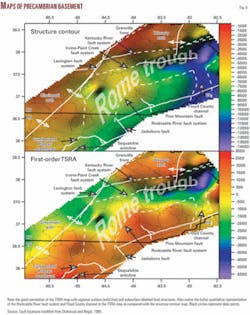
Sparse basement drilling and seismic reflection data in the region have hindered the delineation of the structure in Tennessee and Kentucky. Second-order TSRA values generated from well data were smaller than inferred fault displacements,16 19 20 and therefore a first-order TSRA map was chosen to best delineate the rift system.
Ideally more data are needed to more accurately express the subsurface extent of the rift system. The basement structure contour map clearly shows the main segment of the Rome trough in eastern Kentucky; but the extent of the rift system is not obvious.
It is difficult to identify the Rockcastle River fault system, and the Floyd County channel is represented as a very large feature (due to regional dip masking the relatively small size of the feature). Even with a limited dataset and using a first-order TSRA map, the basement TSRA map can apparently identify all of the major rift systems and project the Rome trough into Tennessee.4
The Floyd County channel also is more pronounce and accurately depicted in TSRA map. Since the amount of data is sparse, the residual maps are ultimately not quantitative or correlatable with estimated fault displacements. Therefore, this map can only be used to generally illustrate fault system locations and provide relative displacement estimates.
Leduc reefs
The Alberta basin is a well known productive hydrocarbon basin. The main target horizons in the basin are the Lower Cretaceous section and the Upper Devonian carbonate reefs,21 such as those in the Leduc formation (Fig. 7). Differential compaction of the overlying strata (i.e., the Ireton shale) over these reefs has created drape structures that become less evident in shallower horizons.22-25
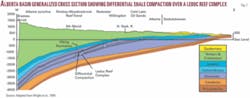
A prominent southwestern regional dip and the localized nature of the differential compaction around the complexes make them difficult to identify and delineate in structure contour maps (Fig. 8). The reefs generally trend NNE and may be associated with basement topography or faults.26 Prospective complexes can be identified by removing the prominent southwestern regional dip from shallower horizons9 and correlating the TSRA values with the estimated amounts of differential compaction.
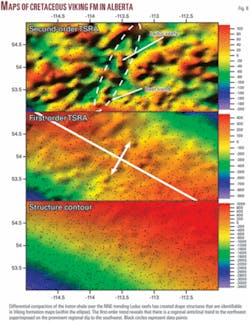
The first-order TSRA map reveals there is a regional anticlinal trend to the northwest superimposed on the prominent regional dip to the southwest. A second-order residual map proved to be more valuable because it notably delineates an anomalous trend that parallels known reefs and production.
The TSRA values also correlate well with differential compaction estimates and reef thicknesses. Note the dominant northeastern trending linear highs in both TSRA maps that may also be related to differential burial or isolated reefs.
It is important to emphasize the mapped horizon is above the reef complexes. This implies well data from nonprospective intervals are capable of yielding useful information about a potential target, and that sometimes is easier to identify a trend by scrutinizing linked surfaces.
Statistical testing
Trend surface statistical tests have been done by previous workers10 to ascertain if particular contouring techniques were more dependable.
Most statistical tests focus on mean error, root mean squared error, and regression slope where a withheld data point is predicted using the remaining data. To produce more accurate results it is necessary to filter existing data because adding data is rarely an immediate option.
Data filtering usually includes deletion of outliner values and anomalous data that can not be validated. Mei10 concluded that cross-validation was important, but statistics cannot distinctly indicate what contouring method is the most applicable.
Standard trend surface analyses include goodness of fit, correlation coefficient, and overall variance.9 These tests, however, yield numerical values that do not help validate a given trend or map but will help determine if the generated map is reliable.
The problem still remains that the effective use of trend surfaces and residuals may not be a statistical problem, but rather dependent on interpreter’s experience and toolkit (i.e., different types of contouring and trend surface algorithms), and dataset properties (i.e., amount of data, clustering, target size, boundary conditions, and numerous geologic factors). Further research into quantifiable tests of validity and geologic correlation is needed, but qualitative analysis should always be implemented whenever TSRA mapping is attempted.
Acknowledgments
We thank Brandon Nuttall of the Kentucky Geological Survey and Elaine Foust of the Tennessee Division of Geology for help with their respective state well databases, and Shilong Mei of the Alberta Geological Survey for an earlier review of this manuscript. This project was funded by DOE grant DE-FC26-02NT15341 awarded to Robert D. Hatcher Jr.
References
- Harris, L.D., and Milici, R.C., “Characteristics of thin-skinned style of deformation in the southern Appalachians, and potential hydrocarbon traps,” USGS Professional Paper 1018, 1977, 40 p.
- Beinkafner, K.J., “Terminal expression of decollement in Chautauqua County, New York,” Northeastern Geology, Vol. 5, No. 3-4, 1983, pp. 160-171.
- Evenick, J.C., Jacobi, R.D., Baker, G.S., and Mitchell, C.E., “Subsurface evidence for faults in the Appalachian basin, western New York State,” Northeastern Geology and Environmental Sciences, Vol. 27, 2005, pp. 1-17.
- Evenick, J.C., “Potential subsurface structures and hydrocarbon reservoirs in the southern Appalachian basin beneath the Cumberland Plateau and eastern Highland Rim, Tennessee, Kentucky, and southwestern Virginia,” PhD dissertation, University of Tennessee, Knoxville, 2006, 402 pp.
- Chayes, F., “On deciding whether trend surfaces of progressively higher order are meaningful,” GSA Bull., Vol. 81, 1970, pp. 1273-78.
- Baird, A.K., Baird, K.W., and Morton, D.M., “On deciding whether trend surfaces of progressively higher order are meaningful: Discussion,” GSA Bull., Vol. 82, 1971, pp. 1219-34.
- Krumbein, W.C., “Measurement and error in regional stratigraphic analysis,” Journal of Sedimentary Petrology, Vol. 28, 1958, pp. 175-185.
- Pelletier, B.C., “Pocona palaeocurrents in Pennsylvania and Maryland,” GSA Bull.,Vol. 69, 1958, pp. 1033-64.
- Davis, J.C., “Statistical and data analysis in geology,” Wiley, New York, 2002, 638 pp.
- Mei, S., “Structure mapping for the Clear Hill-Smoky River region using well log data and geostatistical analysis,” Alberta Geological Survey, ESR 2006-04, 2006, 98 pp.
- Evenick, J.C., “Introduction to well logs and subsurface maps,” PennWell Corp., Tulsa, 2008, in press.
- Gwinn, V.E., “Thin-skinned tectonics in the Plateau and northwestern Valley and Ridge provinces of the central Appalachians,” GSA Bull., Vol. 75, 1964, pp. 863-900.
- Bastedo, J. C., and Van Tyne, A.M., “Geology and oil and gas exploration in western New York,” New York State Geological Association Guidebook, 1990, pp. B1-B23.
- Jacobi, R.D., “Basement faults and seismicity in the Appalachian basin of New York State,” Tectonophysics, Vol. 353, 2002, pp. 75-113.
- Ammerman, M.L., and Keller, G.R., “Delineation of Rome trough in eastern Kentucky by gravity and deep drilling data,” AAPG Bull., Vol. 63, 1979, pp. 341-353.
- Drahovzal, J.A., and Noger, M.C., “Preliminary map of the structure of the Precambrian surface in eastern Kentucky,” Kentucky Geological Survey, Map and Chart Series No. 8, scale 1:500,000, 1995.
- Gao, D., Shumaker, R.C., and Wilson, T.H., “Along-axis segmentation and growth history of the Rome trough in the central Appalachian basin,” AAPG Bull., Vol. 84, 2000, pp. 75-99.
- Parrish, J.B., and Lavin, P.M., “Tectonic model for kimberlite emplacement in the Appalachian Plateau of Pennsylvania,” Geology, Vol. 10, 1982, pp. 344-347.
- Ryder, R.T., Repetski, J.E., and Harris, A.G., “Stratigraphic framework of Cambrian and Ordovician rocks in the central Appalachian basin from Fayette County, Ohio, to Botetourt County, Virginia,” USGS, Map I-2495, 1996.
- Ryder, R.T., Repetski, J.E., and Harris, A.G., “Stratigraphic framework of Cambrian and Ordovician rocks in the central Appalachian basin from Campbell County, Kentucky, to Tazewell County, Virginia,” USGS Map I-2530, 1997.
- Wright, G.N., McMechan, M.E., and Potter, D.E.G., “Structure and architecture of the Western Canada Sedimentary basin,” in Mossop, G.D., and Shetsen, I., comp., “Geological atlas of the Western Canada Sedimentary basin,” Canadian Society of Petroleum Geologists, Alberta Research Council, 1994, pp. 25-40.
- Labute, G.J., and Gretener, P.E., “Differential compactions around a Leduc reef; Wizard Lake area, Alberta,” Bull. of Canadian Petroleum Geology, Vol. 17, 1969, pp. 304-325.
- Mossop, G.D., “Origin of the peripheral rim, Redwater reef, Alberta,” Bull. of Canadian Petroleum Geology, Vol. 20, 1972, pp. 238-280.
- O’Connor, M.J., and Gretener, P.E., “Differential compaction within the Woodbend Group of central Alberta,” Bull. of Canadian Petroleum Geology, Vol. 22, 1974, pp. 269-304.
- Anderson, N.L., Brown, R.J., and Hinds, R.C., “Low- and high-relief Leduc Formation reefs: A seismic analysis,” Geophysics, Vol. 54, 1989, pp. 1,410-19.
- Edwards, D.J., and Brown, R.J., “Understanding the influence of Precambrian crystalline basement on Upper Devonian carbonates in central Alberta from a geophysical perspective,” Bull. of Canadian Petroleum Geology, Vol. 47, 1999, pp. 412-438.
The authors

Jonathan C. Evenick ([email protected]) is a structural geologist working for BP America Inc. He has over 10 years of experience in the Appalachian basin and is currently working on a variety of exploration projects. He has a PhD from the University of Tennessee.

Robert D. Hatcher Jr. ([email protected]) is a distinguished scientist and professor at the University of Tennessee. He is a structural/tectonics geologist who has worked for more than 35 years in the Appalachians after spending a year with the former Humble Oil & Refining Co. (now ExxonMobil Corp.). The National Science Foundation, Department of Interior, Department of Energy’s National Petroleum Technology Office, and private industry support his research.

Gregory S. Baker ([email protected]) holds the Jones/Bibee Endowed Professorship in Geophysics at the University of Tennessee, where he is an associate professor. He has over 15 years of experience in near-surface geophysics. His current research is funded by the DOE, NSF, the Department of Defense, and Environmental Protection Agency.