Changing feed conditions push Egyptian gas plant to upgrade CO2 membrane system
Changing feed operating conditions at Khalda Petroleum Co.’s Salam gas processing plant in Egypt’s Western Desert led the company to make changes to its membrane system for removing CO2.
The plant’s feed operating conditions had changed over time. An increase in feed flow rate and feed CO2 content combined with membrane permeability variationsdue to natural membrane aging and userequired adjustment in system operating conditions to fulfill KPC targets of maximizing system hydrocarbon recovery and meeting acceptable CO2 sales-gas specification.
This article will present the flexibility of membrane systems when such changes occur and describe how performance of a two-membrane-stage system was optimized.
Membrane concept
Total worldwide production of natural gas is about 103.8 tcf/year.1 All of this gas requires some treatment, and about 20% requires extensive treatment before it can be delivered to the pipeline. As a result, several billion dollars’ worth of natural gas separation equipment is installed annually worldwide. The membrane market share is about 2%, essentially all for CO2 removal.2
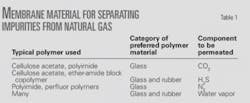
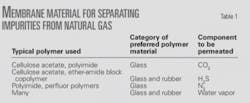
This fraction will likely increase because other applications of membranes in the natural gas processing industry are under development.2 3 Membranes can be used to separate other gaseous components such as H2S, N2, He, and water vapor from nonassociated or associated gas stream under a partial pressure differential.4 Table 1 shows typical membrane materials that can be used to separate the impurities from natural gas.2
Removal of CO2 is the only membrane-based natural gas separation process currently practiced on a large scale; more than 200 plants have been installed. The membrane system operates on the principles of selective permeation.5 6
Certain gases permeate or pass through the membrane more easily than others (Fig. 1). This allows the more rapidly permeating (fast) components to be collected in one stream and the slower permeating (slow) components to be collected in a second stream. In natural gas treating, CO2, hydrogen, helium, H2S, and water vapor are highly permeable gases, sometimes characterized as “fast” gas molecules that permeate to a greater extent across the membrane to the lower pressure side than do the “slower” gases (i.e., hydrocarbons).
The permeate gas will have a higher concentration of the fast gases and a lower concentration of the slow gases, relative to the feed. The gas that remains on the higher pressure side, also called the residual gas, will be depleted in the fast gas components relative to the feed gas.
The driving force for permeation is the difference in partial pressure of a given component between the feed (high pressure) side and the permeate (low pressure) side of the membrane. The greater the partial-pressure difference, the greater the driving force.6
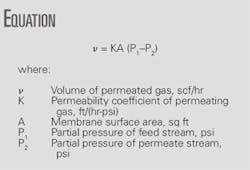
A simple mathematical representation (accompanying equation box) can illustrate gas transport across a membrane.6 The permeability coefficient, K, is a function of both the solubility and the diffusivity of the gas in the polymer matrix. Several mathematical models are available that derive the permeability coefficients.7 8
Membranes have two performance characteristics that determine methane product recovery and purity: permeation rate and selectivity.
Permeation rate or flux is the rate at which a gaseous component can diffuse through the membrane medium to the low-pressure side. The rate of permeation for each component is determined by the following:
- The characteristics of the component.
- The characteristics of the membrane.
- The partial pressure differential of the gaseous component across the membrane.
Since the permeation rate for CO2 is greater than for methane, increased flux through the membrane will increase the methane product purity, but decrease the methane recovery in the residual gas stream. Selectivity refers to the ratio of the permeation rates of a fast gas (CO2) and a slow gas (methane or other hydrocarbon). The selectivity of CO2 to methane determines the efficiency of the separation and the methane recovery.
Salam gas plant
Khalda Western Desert gas development project at Salam is 70 km from Matrouh. The plant processes gas condensate from Salam field, Qasr field, South Umbarka, and an oil plant’s associated gas. The project produces about 200 MMscfd of export gas at an export pressure of 101 bara and 9,000 stock tank bbl (stb) of condensate. The plant started up in July 1999.
The sales gas is designed to have a maximum CO2 content of 3% mol, a maximum H2S content of 4 ppm (vol), a gross heating value greater than 1,040 btu/scf, a water dewpoint of less than 0.0º C. at 71 bara, and a cricondentherm of 5º C. The condensate is designed to have a maximum of 11 psi rvp.
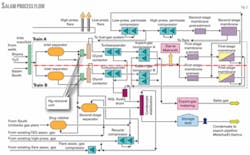
The flow diagram of the Salam gas plant (Fig. 2) shows gas flowing from the wells into two parallel trains. First it enters a three-phase separator where the main water-condensate-gas separation takes place. Gas from the three-phase separator goes to the mercury-removal unit. Then it flows to the glycol contactors to remove water from the gas to avoid hydrate formation and to achieve water-content specifications.
Gas is then diverted to the dewpointing package, whose function is to separate entrained traces of condensate and heavier hydrocarbons that condense as liquids from the gas at lower temperatures. This step achieves hydrocarbon dewpoint specifications using turbo-expander technology.
After dewpointing, the gas enters the gas-sweetening system (two-stage membrane package) to reduce CO2 in the export gas. The final step is to export the gas via the export compressors.
Condensate collected from the various processing steps moves to stabilization before being stored in the three storage tanks. The stabilizer tower removes the light hydrocarbons to avoid release in the tanks and to achieve the rvp specification. Condensate is then shipped from the storage tanks via shipping pumps to El-Hamra.
Membrane system
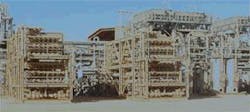
The membrane system at the Salam gas plant had been started up in July 1999 (Fig. 3) and has operated successfully and without major upsets or membrane replacement. It includes two membrane stages. Each stage contains a pretreatment unit and membrane skids. Each pretreatment unit consists of a filter coalescer, a guard bed, and a particle filter. Each membrane skid consists of membrane tubes containing membrane elements.
These elements consist of cellulose acetate membrane sheets that are bound onto a woven cloth support. A membrane sheet has two layers: a relatively thick microporous layer that is in contact with the cloth support and a thin active layer on top of the microporous layer.
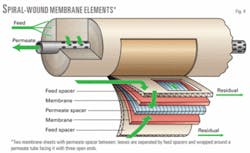
A membrane element is a spiral-wound assembly with a perforated permeate tube at its center (Fig. 4). One or more membrane leaves are wrapped around the permeate tube. Each leaf contains two membrane-cloth composite layers that are separated by a rigid, porous, fluid-conductive permeate channel spacer. These leaves are separated from each other by a high-pressure channel spacer. The membrane leaves are sealed with an adhesive on three sides; the fourth side is open to the permeate tube.6
During the sweetening process, the feed gas from the turboexpander is compressed through the first-stage export compressors. The feed gas is then delivered to the pretreatment section of the membrane unit that provides key protection for the membrane elements and keeps membrane feed dry and free of contaminants. The gas first passes through a high-efficiency filter coalescer for removal of entrained contaminants such as sand, pipe scale, lubricating oil, and hydrocarbon, or water condensate. The filtered gas then passes through a guard bed to remove trace contaminants and is then sent through a particle filter to remove any entrained dust or particulates from the guard bed.
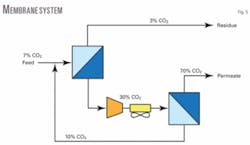
After exiting the pretreatment section, the feed gas combines with the recycle gas from the second-stage membrane before entering the first-stage membrane skids (Figs. 2 and 5). This combined stream has a design CO2 content of 6.34% mol and is the feed gas to the first-stage membrane skids.
As the feed gas passes through the membrane tubes, the gas is separated into a high-pressure methane-rich gas (residual), and a low-pressure gas stream concentrated in carbon dioxide (permeate).
The first membrane stage is designed to produce a residual gas (sales gas) with 3% mol CO2 content, which is supplied to the export compressors for gas metering. The permeate gas containing 30% mol CO2 is compressed through the permeate compressor and then directed to the second stage membrane package.
The second membrane stage is designed to recover most of the hydrocarbons from the first-stage permeate gas. The second membrane stage residual gas is recycled back to the first membrane stage. The second-stage permeate gas containing 71% mol CO2 is flared.
Membrane operational flexibility
With time, plant operating conditions at the Salam gas plant have changed:
- The feed gas CO2 concentration increased from 6.34% mol to 8.5% mol.
- The feed flow to the plant increased from 206 MMscfd up to 235 MMscfd.
This resulted, in August 2007 after 8 years of operation, in a CO2 concentration increase in the sales gas up to 4.7% mol from the designed 3% mol and an increase in sales-gas flow rate to 210 MMscfd from 200 MMscfd.
This observation is in line with the well-known principles of membrane systems. For traditional solvent-based CO2-removal technologies, unit size is mainly driven by the absolute amount of CO2 to remove. Membrane systems, however, are CO2 bulk-removal technologies for which unit size is mainly driven by the percentage of CO2 removal. A given membrane system designed to reduce CO2 down to 3% mol from 6% mol (=50% CO2 removal) will also be able to handle a gas containing 8% and produce a gas with 4% mol, all other conditions remaining constant (feed-gas flow, pressure, temperature, so forth).5
Moreover, membrane systems are modular and can easily cope with increase of feed flow rate. An increase of feed flow rate requires a proportional increase in membrane area requirements. If the membrane area is fixed, an increase in feed flow will result in an increase of CO2 in the produced gas.
Next to the changes in feed-gas conditions (flow and composition), normal membrane aging can result in a CO2 concentration increase in the sales gas. Membranes are subjected to a lifetime that varies with feed-gas conditions, membrane pretreatment design, and operator skills. Salam gas plant has shown excellent performance with membrane lifetime of more than 8 years.
Design of a membrane system takes into account the natural performance decline (membrane aging) by sizing the system for end-of-life conditions, so that the system will always reach the required specifications. During the lifetime of the membrane, the system will require minor operational adjustments as the membrane properties (selectivity and permeability) vary.
This article will further describe how the Salam gas plant has been operated as feed-gas conditions have changed and as membranes have aged, keeping in mind KPC’s objectives of producing gas with an acceptable CO2 content while minimizing hydrocarbon losses that translates directly in sales gas volume and revenue.
Adjustment to changes
Several operating parameters affect gas separation by membrane, including feed-gas flow and composition, pressure differential across the membrane, gas temperature, online membrane area, and sales-gas specification. A good understanding of the effects of these process parameters is important to maximize the efficiency of the operation.
When conditions are changing, plant operation needs to be reassessed in order to find a new optimum operating mode in term of sales-gas specification and hydrocarbon recovery (directly related to sales-gas volume and revenue). For the two-membrane-stages system at Salam gas plant, not only the two individual membrane stages’ performance has been reassessed, but also the overall system including recycling step from the second to the first membrane stage.
The following parameters, individually or combined, can be used to optimize plant operation in order to cope with the changes in feed conditions and the natural membrane aging:
- Membrane area of first and second membrane stage.
- Temperature of first and second membrane stage feed gas.
- Pressure of first and second membrane stage feed gas.
- Pressure of first and second membrane stage permeate gas.
- Replacement of those membranes that have reached the ends of lives, in first or second membrane stage.
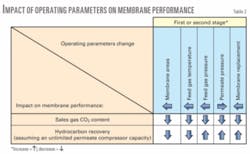
Table 2 illustrates the qualitative impact of the operating parameters on the overall two-stage membrane system. The impact, in absolute terms, of each of these parameters will vary. In combinations of different parameters, therefore, each of them will weigh more or less on the overall performance. Note that other factors, such as permeate compressor capacity limitations, need to be taken into account as well.
Table 2 shows that the following parameter adjustments always have a positive effect, both on sales-gas CO2 content (decreased) and on hydrocarbon recovery (increase): feed pressure increase, permeate pressure decrease, as well as membrane replacement.
The following describes the impact of the operating parameters, independently.
First, second-stage area
With an increase in the first-membrane stage area, the unit can handle a constant feed flow rate and produce sales gas with a lower CO2 concentration or can handle a higher feed flow rate producing sales gas with the same CO2 concentration.
In the former case, the throughput feed gas to the second membrane stage will increase. If the permeate compressor capacity is not limited, a higher flow richer in CO2 will be recycled back to the first membrane stage. The second-stage permeate gas flow rate will slightly increase. (Hydrocarbon losses increase as a lower sales-gas CO2 spec is reached.)
An increase in second-membrane-stage area will result in a second-stage residue with a lower CO2 concentration and thus also a lower CO2 concentration in the first membrane-stage feed gas and in the sales gas. A higher membrane area will allow not only a higher CO2 permeation flow but also a higher methane permeation flow and thus an absolute increase in vented hydrocarbons.
First, second-stage feed temp.
The permeability of gases generally increases with increasing temperature. The permeability for carbon dioxide, however, increases at a lower rate than methane and other hydrocarbons with an increasing temperature. This means that selectivity for carbon dioxide over methane decreases as the operating temperature increases. Consequently, methane-product recovery (hydrocarbon recovery) will decrease, while purity (sales-gas CO2 content) will increase as the operating temperature increases, all other operating conditions being constant.
First, second-stage feed pressure
The increased pressure creates a greater driving force across the membrane and results in a net increase in permeation through the membrane.6 The membrane area requirement therefore drops or, for a fixed membrane area, a lower CO2 concentration in the sales gas/recycle stream will be reached.
First, second-stage permeate pressure
A decrease in permeate pressure increases the driving force across the membrane and results in a net increase in permeation through the membrane. The membrane area requirement therefore drops or, for a fixed membrane area, a lower CO2 concentration in the sales gas will be reached. On the other hand, a lower amount of hydrocarbons will permeate, which translates in a higher hydrocarbon recovery.
A decrease of the second-membrane-stage permeate pressure will result in a decrease in amount of hydrocarbon permeating through the second membrane stage and thus in a better overall hydrocarbon recovery.
First, second-stage replacement
An aging membrane element can show declining selectivity. This means that more methane permeates at a fixed CO2 permeation. Consequently, more hydrocarbons are lost, and the load on the permeate compressor (in the case of a first-membrane-stage decline) increases. Therefore, a membrane at its end of life will need to be replaced.
Membrane systems are built modularly and systems can thus be easily and partially isolated. After replacement of a high number of membrane elements, a step change in plant performance becomes apparent:
- An increased selectivity of the first-stage membranes translates in a lower permeate compressor load.
- An increased CO2 permeation rate permits reduction in the first-stage membrane area or an increase in the first-stage permeate pressure.
- An increased selectivity of the second membrane stage translates into a lower hydrocarbon content in the vented second-stage permeate gas and thus a higher hydrocarbon recovery. It also leads to a lower CO2 concentration in the recycle stream; this also results in a lower CO2 content in the sales gas.
In conclusion, a (partial) membrane replacement effort is completed only after the operating parameters of the membrane system are fine tuned in order to reach the correct sales-gas specification, while maximizing the hydrocarbon recovery.
Adjustment to operational changes
The following parameters have been tested at Salam gas plant in order to cope with the changing feed conditions (CO2 content and flow increase) as well as with the normal aging of the membranes:
- In August 2006, the second-membrane-stage area was increased by 20%. This resulted in a decrease of the CO2 content in the sales gas. In the first membrane stage, an increase of membrane area has not been envisioned.
- To determine the optimum second-membrane-stage operating temperature, operators gradually increased the feed temperature of the second membrane stage with continual monitoring of CO2 content in the second-stage permeate gas and in the sales gas. As expected, it was found that with an increase in the feed temperature of the second membrane stage, the CO2 concentration in the second stage residue gas decreased and with it the CO2 concentration in the feed gas to the first membrane stage. But also observed was that the amount of hydrocarbons lost through the second membrane stage permeate increased.
Increasing feed-gas temperature in the first membrane stage hasn’t been implemented at Salam gas plant due to permeate compressor capacity limitation and the objective to maximize hydrocarbon recovery. - In 2007-08, membrane elements have been replaced in both the first and second stages. Replacement of the membrane elements in the second stage did result in a significant decrease of the CO2 content in the sales gas to 3.8% mol from 4.7% mol. First stage membrane replacement is still under evaluation.
- The deeper CO2 cut (to 3.8% from 8.5% compared with design of 3% from 6.34%) has resulted in a higher load on the permeate compressor. Excess first-stage permeate (exceeding the compressor capacity) is flared and results in additional hydrocarbon losses.
- In terms of permeate pressure, design plant operating conditions are based on the lowest possible permeate pressure. A temporary increase of 80% of the permeate pressure has been tested on the second stage, resulting in a significant increase in hydrocarbon losses.
- Feed pressure increase has not been tested at Salam gas plant.
Acknowledgment
The authors thank Khalda Petroleum Co. for permission to publish this article. The authors are also grateful to the gas operations department and field staff at Khalda Petroleum Co. and to the technical staff at UOP whose ideas and discussions largely formed the basis of this article.
References
- BP Statistical Review of World Energy, June 2008.
- Baker, R.W., “Membrane Technology and Applications,” Second Edition, Chapter 8, London: John Wiley & Sons Ltd., 2004.
- Spillman, R.W., “Economics of Gas Separation by Membranes,” Chem. Eng. Prog, 85, 41 (1989).
- Fournie, F.J.C., and Agostini, J.P., “Permeation Membranes Can Efficiently Replace Conventional Gas Treatment Processes,” SPE paper 13729 , Journal of Petroleum Technology, June 1987, pp. 707-712.
- Dortmundt, D., Schott, M., and Cnop, T., “Sour Gas Processing Applications using Separex Membrane Technology,” UOP LLC, Des Plaines, Ill., 2007.
- Dortmundt, D., and Doshi, K., “Recent Developments in CO2 removal membrane technology,” UOP LLC, Des Plaines, Ill., 1999.
- Koros, W.J., “Membrane Based Gas Separations; Data Base and Models for Glassy Polymers,” presented at the Sunriver Membrane Conference, Sept. 19, 1983, Sunriver, Ore.
- Dinello, M.S., Narayan, R.S., and Patton, C.J., “Bulk CO2 Removal Achieved through Membrane Separation,” SPE paper 13281, SPE Production Engineering, February 1989, pp. 88-92.
The authors
Mahmoud Abu El Ela ([email protected]) is an assistant professor in the Petroleum Engineering Department, Cairo University, and also works as a petroleum process consulting engineer at Khalda Petroleum Co. He previously worked as a research engineer at Woodside Research Foundation, Curtin University of Technology-Australia. Abu El Ela holds a BSc and MSc in petroleum engineering from Cairo University (Egypt) and a PhD from Curtin University of Technology (Australia). He is a member of the Egyptian Engineers Syndicate and SPE.
Mostafa Nabawi is a general manager in the gas operations department at Khalda Petroleum. He previously worked as assistant general manager in the gas operations department at Khalda Petroleum. Nabawi holds a BSc in mechanical engineering from Assuit University, Egypt. He is a member in the Egyptian Engineers Syndicate and SPE.
