CORROSION MODELING—Conclusion: Field inputs guide internal pitting corrosion model
Laboratory experiments and observation of pit growth rates in six operating fields have led to development of a model to predict internal pitting corrosion of oil and gas pipelines. The inputs required to use the model (construction and operational) are readily available from the field.
The model accounts for the statistical nature of pitting corrosion, predicts the growth of internal corrosion pits, considers the variation of pitting corrosion rate, and determines any error in the prediction.
The first part of a two article series (OGJ, Nov. 26, 2007, p. 68) examined the pitting corrosion mechanism as well as problems in predicting internal pitting corrosion of oil and gas pipelines, before beginning an assessment of the parameters influencing internal pitting corrosion.
This second, concluding article continues the assessment of parameters begun in Part 1 and discusses both the predicting model and its validating observations.
Operational parameters
• Pressure. Higher pressure (or partial pressure of a particular species) induces higher corrosion if it increases the dissolution of metal and decreases the pitting corrosion rate if it facilitates the formation of intact surface layers.
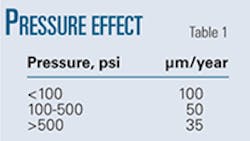
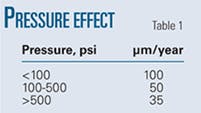
Table 1 shows the experimentally determined variation in pit growth rates with pressure.
• H2S partial pressure. The acid formed by the dissolution of H2S is about three times weaker than that formed by the dissolution of CO2 (i.e., carbonic acid), but H2S is about three times more soluble than CO2 gas, resulting in similar contributions of CO2 and H2S partial pressures to lower pH.
The formation and stability of iron sulfides determine the effect of H2S on the pitting corrosion rate. Iron sulfides are generally good electronic conductors and have low overpotential for hydrogen evolution, noble electrode potentials, and defect structures.
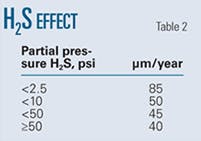
Table 2 shows the experimentally determined variation in pit growth rates with H2S partial pressure.
• Sulfate ion. Anions such as sulfate inhibit pitting by raising the pitting potential. Sulfate might therefore raise the critical pitting temperature below which no stable pitting occurs at any electric potential.
Sulfate’s effect then centers on the ability of metastable pits to become repassivated. Stabilization is tied to the sulfate layer that develops over the metastable pit. Sulfate ion’s effect is predominant only in the presence of H2S. Sulfate ion had no effect on corrosion rate in experiments.
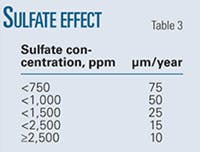
Table 3 shows the experimentally determined variation in pit growth rates with sulfate pressure.
• CO2 partial pressure. Dissolution of gaseous CO2 in solution leads to formation of carbonic acid. This weak acid reacts with iron to form iron carbonate. The formation and stability of iron carbonates determine CO2’s effect on pitting corrosion rate.
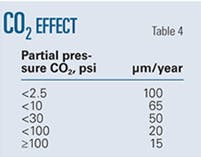
Table 4 shows the experimentally determined variation in pit growth rates with CO2 partial pressure. Increasing the partial pressure of CO2 causes the surface layers to become compact, leading the pitting corrosion rate to decrease with CO2 partial pressure.
• Bicarbonate ion. Bicarbonate ion effect becomes prominent only in the presence of CO2. Carbon dioxide dissolved in water readily combines with water to form carbonic acid. The carbonic acid then dissociates into the hydrogen ion and bicarbonate ion. The excess bicarbonate shifts the equilibrium to the left, decreasing the rate of CO2 corrosion.
Bicarbonate also acts as a buffer. A bicarbonate buffer can absorb H+ ions and neutralize the acids produced by CO2 dissolution. This buffer contains a weak acid, carbonic acid, H2CO3, and a bicarbonate anion, HCO3.
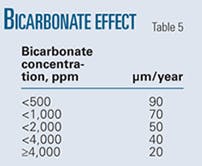
Table 5 shows the experimentally determined variation in pit growth rates with bicarbonate concentration.
• Chloride ion. Chloride ions are the most common cause of pitting. Like other halides, chloride ion acts as a very potent agent in destroying otherwise protective passive surface layers. In the case of chloride-induced pitting, the corrosion mechanism also involves strong chloride concentrating effects in a growing pit, accelerating the rate of pit development in an autocatalytic growth process.
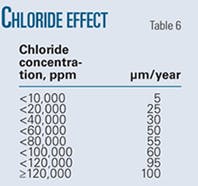
Table 6 shows the experimentally determined variation in pit growth rates with chloride ions.
Computable parameters
Computable parameters are extensively used in understanding corrosion and include pH, wall-shear stress, and flow regime. Either the values of the operational parameters1 2 or field measurements can provide the basis computing these parameters.
Predicting corrosion
The three construction parameters required for predicting internal pitting corrosion of oil and gas pipelines are inclination of the pipe, ID, and OD (or WT). Carbon steel is predominantly used for construction of oil and gas pipelines. Minor variations in the composition of carbon steel are not considered.
The nine operational parameters required are production rates of oil, water, gas, and solid, total pressure, partial pressures of CO2 and H2S, temperature, and concentration of chloride ions. Each of the operational parameters individually can alter pitting corrosion rates. Concentration of bicarbonate ion alters the pitting corrosion rate only in the presence of CO2. Similarly, concentration of sulphate ion alters pitting corrosion rate only in the presence of H2S. The ultimate rate at which pits will propagate depends on the combined effect of all operational parameters.
While prediction of the individual effect of each parameter can happen deterministically, the combined effect of these variables needs application of statistical principles.
Several methods have predicted the probability of the system pitting corrosion rate based on short-duration measurements. These methods include extreme value statistics,3 Weibull distribution function,4 Gumble distribution function,3 corrosion damage function,5 stochastic process,6 Markov process,4 and artificial neural network.4
All approaches accept that pitting corrosion’s driving force is a distributed parameter, while varying in their treatment of driving force and pattern of distribution.
This article assumes that each operational variable produces an individual pit growth rate (resulting in nine different pitting corrosion rates) and that pit growth rate stemming from the variables not considered (e.g., acetic acid effect) is the mean value of the nine pit growth rates. The tenth parameter does not affect the predicted pitting corrosion rate but does increase the uncertainty of the prediction.
The actual pit growth rate occurring in the oil and gas pipeline is the distributed function, consisting of the mean value of the 10 pit growth rates. The resultant pit growth rate is the rate at which the pits will start to grow in the localized anodic region where the surface layers are removed.
Except for one operational variable (water), removal or control of one or more operational variables will change the pit growth rate, but not prevent pit growth. The absence of water in a location, however, prevents pitting corrosion regardless of the other variables.
Various reasons, including partial reformation of surface layers, local solution saturation, change of corrosion potential, and local increase of pH prevent pits from growing continuously at the same rate at which they start. Pit growth rate diminishes parabolically as a function of time.
The assumptions made in obtaining pit growth rates render the overall pit growth rate probabilistic in nature. The accuracy of this prediction lies within the standard deviation of the pit growth-rate prediction.
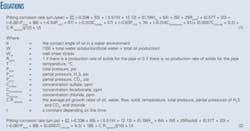
Laboratory experiments conducted at pipeline operating conditions, field experiments conducted over 4 years in six operating fields, and assumptions made on the probabilistic nature of the pitting corrosion yield the pitting corrosion rate of oil and gas pipelines expressed by Equation 1 (in accompanying equation box).
Development of this model used the following assumptions:
- Type of pipeline steel used will not affect corrosion rate.
- Volume and type of solid production is irrelevant.
- H2S concentration is not zero, otherwise sulfate concentration is irrelevant.
- CO2 concentration is not zero, otherwise bicarbonate concentration is irrelevant.
- Unless the actual emulsion type is determined at or above 30% water, the emulsion is oil-in-water.7 8
The simplified pitting corrosion rate formula given above cannot account for several situations. Chief among these is when H2S or CO2 partial pressure is zero. The sulfate ion effect depends upon the presence of H2S and the bicarbonate ion effect depends on the presence of CO2.
The absence of H2S requires modification of the simplified pitting corrosion rate formula, removing the PH2S and Csulfate terms, replacing them with a value of 85, and reducing the denominator by 1. The absence of CO2 requires modification of the simplified pitting corrosion rate formula, removing the PCO2 and Cbicarbonate terms, replacing them with a value of 100, and reducing the denominator by 1.
In the absence of both H2S and CO2, Equation 2 can predict the simplified pitting corrosion rate.
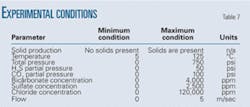
Within constrains of the assumptions made and range of conditions in which the experiments were conducted (Table 7), Equation 2 can predict the internal pitting corrosion of sour and sweet pipelines.
Statistical functions drive the pitting corrosion rates of oil and gas pipelines, making the predicted pitting corrosion rate probabilistic. The standard deviation of Equation 1 and Equation 2 determined the error in the prediction. Gumble’s probability chart could also distribute the driving forces.
Validation
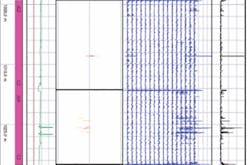
As part of its integrity management program the company examined the pipeline using magnetic flux leakage. The analysis showed pits penetrating up to 72% of WT (Fig. 1). In order to avoid a leak, and the resulting environmental damage, the company shut down the pipe and replaced the damaged section. Subsequent depth-gauge measurements of the damaged sections of pipe showed that 74.8% of the wall had been penetrated in one section.
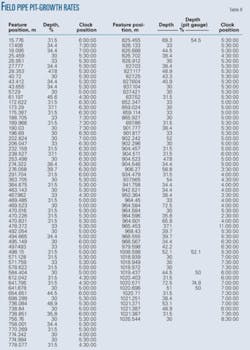
Table 8 shows pit depths and their locations along the pipe.
This 1-km pipe section first started receiving water flood in January 2004. Shutdown and repair occurred in November 2005. This pipeline operated without the use of inhibition. Pitting corrosion, therefore, can be reasonably assumed to have occurred over 23 and 24 months.
The majority of the pits discovered in the pipe section penetrated less then 50% of the 3.18 mm WT. Pitting corrosion took place at a calculated rate of 1.19 to 1.24 mm/year, depending on whether the pipe was in service for 23 or 24 months.
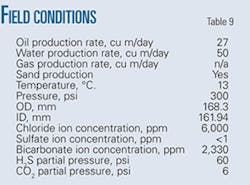
Tables 9 and 10 show operating conditions of the pipeline and detailed pitting corrosion rate calculations, respectively.
These field data validated the pitting corrosion model. Among the data required to use the model, the only data missing were the gas production rate, the emulsion inversion point, and the wettability of the oil. Emulsion inversion point and oil wettability require experimental determination. Absent the results of these experiments, this article assumes the pipeline was operating under water-wet conditions carrying oil-in-water emulsion.
Production of the gas through casing venting complicated determination of the gas production rate. Absent the actual gas production rate, this article simulated both low flow and high flow regimes by calculating the pitting corrosion rate for both conditions.
Table 11 shows predicted pitting corrosion rates of 0.6-1.8 mm/year for the low flow regime and 0.6-2.0 mm/year for the high flow regime. This compares quite favorably to the observed corrosion rate of 1.19-1.24 mm/year.
References
- Papavinasam, S., Doiron, A., and Revie, R.W., “Integrity Management of Pipelines: Internal Corrosion Control,” NACE Corrosion 2006, San Diego, Mar. 12-16, 2006,
- Papavinasam, S., Demoz, A., Michaelian, K., and Revie, R.W., “Further Validation of a Pitting Corrosion Model.” NACE Corrosion 2008, New Orleans, Mar. 15-20, 2008.
- Gumbel, E.J., “Statistical Theory of Extreme Values and Some Practical Applications,” National Bureau of Standards, Applied Mathematics Series, No. 33, 1954.
- Hong, H.P., “Application of the Stochastic Process to Pitting Corrosion,” Corrosion, Vol. 55, No. 1, p. 10, 1999.
- Macdonald, D.D., and Macdonald, M.U., “Distribution Functions for the Breakdown of Passive Films,” Electrochimica Acta, Vol. 31, p. 1079, 1986.
- Papavinasam, S., Revie, R.W., Friesen, W., Doiron, A., and Panneerselvam, T., “Review of Models to Predict Internal Pitting Corrosion of Oil and Gas Pipelines,” Corrosion Reviews, Vol. 24, Nos. 3-4, pp. 173-230, 2006.
- Papavinasam, S., Doiron, A., Panneerselvam, T., and Revie, R.W., “Predicting Internal Pitting Corrosion of Oil and Gas Pipelines: Hydrocarbon-Wet to Water-Wet Transition,” NACE Corrosion 2006, San Diego, Mar. 13-17, 2006.
- Papavinasam, S., Doiron, A., and Revie, R.W., “Empirical Equation to Predict Conditions for Solid Deposition,” Materials Performance, Vol. 46, No. 8, p. 58, 2007.
