PIPELINE INSPECTION-Conclusion: Corrosivity modeling helps determine current condition
Modeling the corrosivity of liquids transported over the life of a pipeline can determine the current condition of pipelines in which in-line inspection is not possible. Such modeling also allows development of a risk-based approach to extending asset life.
The first part of this two-article series (OGJ, Nov. 5, 2007, p. 92) described the parameters of the risk-based approach and presented the first of two case studies in which use of uncertainty modeling helped assess a pipeline’s current condition.
This second, concluding, article presents the second case study.
North Sea case
A North Sea operator with an extensive subsea pipeline network experienced difficulty in performing inline inspection in many of its pipelines. Proper integrity management, however, required system-wide assurance of integrity.
While the operator routinely collects inspection data from related lines that are accessible (for example when a section of the pipeline crosses the topside process systems or onshore process facilities), this does not on its own provide confidence in the condition of the subsea section of the pipelines and therefore does not satisfy corporate requirements for the assurance of the integrity of each of the pipelines. The operator therefore decided to carry out a comprehensive assessment of all pipelines using the statistical modeling-based approach.
Using this approach to develop a written scheme for examination (WSE) for each pipeline provides an auditable trail and clearly identifies corrosion threats and mitigation measures.
The ages of the pipelines in the network vary considerably, and they carry a variety of substances, from dry gas to wet oil to methanol. Consistently assessing the integrity of each pipeline establishes an overall picture of asset condition across the network.
This case study demonstrates the process of developing a WSE for one of the operator’s gas pipelines.
Data collection
Considering the historic operating condition of each pipeline provides an estimate of its likely cumulative corrosion profile. Older pipelines often have little (if any) operating data available, with much of what does exist held by inaccessible legacy data systems. The quality of the data is also often poor.
Uncertainty modeling approach in this example captures tacit knowledge and embeds it in a software system that can be updated annually.
Extensive data collection and interpretation took place. Discussions with the operator, review of production profiles for each offshore asset, and review of design and operating data for appropriate reservoirs allowed reasonable estimation of the following key corrosion-related input parameters:
- Operating conditions (temperature, pressure, and flow rates).
- Reservoir parameters (CO2 content and water cut).
- Reservoir water chemistry (bicarbonate and total dissolved solids).
- Chemical injection philosophy (estimates against target levels).
- Pigging philosophy (estimates against target levels).
- Pipeline physical parameters (e.g. design code, material of construction, nominal wall thickness, original corrosion allowance, etc.).
Each of the input parameters for each of the defined operating periods then receives a range of credible values. The data collected and national production statistics for the region allow identification of major operating changes in the pipeline life, including the tie-in of new wells and reservoirs.
Cumulative assessment
The semi-qualitative pipeline corrosion risk assessment model enables assessment of CO2 corrosion, microbial-induced corrosion, and oxygen corrosion in accordance with standard industry practice. The model combines the Norsok CO2 corrosion model,1 the Shell Global Solutions MIC model,2 and the Berger and Hau oxygen model3 into corrosion-rate equations to enable a cumulative assessment and computation of a pipeline’s likely degradation. Assessing the number of “wet days” based on an analysis of routinely monitored process parameters (e.g. dew point) allows assessment for nominally dry gas pipelines.
The model again uses a Monte Carlo simulation to take a range of input data through the oxygen, carbon dioxide, and microbial influenced corrosion modules (as applicable) to calculate corrosion-rate ranges. In this case, the @Risk analysis package performed the calculations and analysis.
The operator may use gathered data to subdivide pipeline historical operating conditions into as many time periods as required to capture significant changes in pipeline operations. Summing the predicted metal loss for each historical period provides an estimate of the distribution total metal loss to date. The corrosion-rate range calculated for the final time period, in combination with the metal already lost, predicts a probability profile that defines pipeline time-to-failure based on the minimum allowable wall thickness provided by the integrity assessment.
Relevant parameters considered for the gas line include:
- Gas flow rate.
- Water rate.
- CO2 content.
- Pipeline pressure.
- Pipeline temperature.
- Bicarbonate content.
- TDS.
- Fluid shear stress.
- Glycol content.
- Sulfate content.
- Extent of prolonged oxygen ingress (> 50 ppb).
- Use of biocide and number of days wet.
In the first 10 years of operation, the gas flow rate remained reasonably constant at an average of 221 MMcfd, ranging between 107 and 351 MMcfd. It then dropped to an average of 52 MMcfd, (22-76 MMcfd) after 20 years.
During this period the produced-water rate, CO2 content, pipeline pressure, and temperature remained essentially constant, varying to the same degree. But the TDS, shear stress, glycol content, and sulfate levels increased with time. Days wet stayed the same at about 10%.
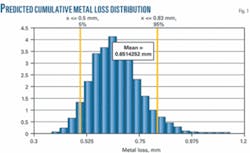
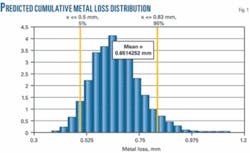
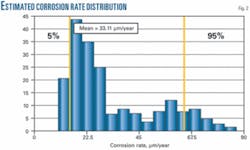
Putting parameter distributions into the three separate corrosion rate models (CO2, MIC, and O2) for each operating period allowed an estimate of the cumulative metal loss distribution to date, as well as the current corrosion-rate distribution for the line (Figs. 1-2).
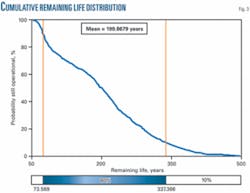
Comparing these to nominal wall thickness and minimum allowable wall thickness (in accordance with the relevant pipeline design code) allows prediction of the remaining life of the pipeline (Fig. 3).
WSE
The written scheme of examination presents the critical input parameters, result of risk assessment, and inspection and monitoring requirements in a straightforward manner.
Updating operating-period input parameters and re-running statistical analysis allows the WSE to be updated annually, providing a record of the risk-based corrosion assessment and keeping an electronic record of operating conditions in addition to generating the formal operating record of the WSE itself.
Another valuable aspect of the WSE is the “tornado plot,” which presents the parameters that most affect the overall result, in this case temperature and glycol content. The plot allows the engineer to determine either which missing data is most important or which parameter is most critical to keep under control.
Data validation
A reality check of predicted data with regards to the condition of the line is an important part of overall pipeline assessment. Where an ILI has been carried out this occurs as a like-for-like comparison of measured vs. predicted metal loss distributions.
Where ILI, however, is not possible (and since lack of ILI data is one of the main drivers for this approach, this is often the case) then comparison of what little information is available can determine the overall credibility of the approach.
The case history presented here describes a nominally dry gas export subsea pipeline. Despite the dry status of the line, however, about 12 cu m/year of water and glycol are carried over from the dehydration system. Inspection of the export riser on the gas platform in 2002 and 2003 predicted metal loss after 20 years of between 0.8 and 1.5 mm. This compares with the model average for the pipelines (which operate at a lower temperature than the riser) of 0.65 mm (range 0.38-1.14 mm).
Liquids carried over from the dehydration process contain up to 80% glycol. The extremely low water content of the line yields a corrosion rate similar to condensation water, with a factor of 0.1 applied.4
Corrosion monitoring at the onshore reception facilities and offshore platform export line show an average metal loss of 0.027 mm/year and 0.001 mm/year, respectively. This compares with a current average calculated value of 0.028 mm/year, range 0.02-0.07 mm/year (Fig. 2).
Such monitoring results show the overall pipeline corrosion assessment model to be in good agreement with the limited practical data available and a reasonable assessment of overall pipeline condition. The projected remaining life of 99.99% at 49 years, 99.9% at 54 years and 90% for 75 years, is considered reliable based on current operating conditions.
References
- Norsok M-506, “CO2 Corrosion Rate Calculation Model,” Norwegian Technology Standards Institution, 2005.
- Pots, B.F.M, et al., “Improvements on de Waard-Milliams Corrosion Prediction and Applications to Corrosion Management,” NACE Corrosion 2002, Denver, Apr. 7-12, 2002.
- Berger, F.P., and Hau, K., “Mass transfer in turbulent pipe flow measured by the electrochemical method,” International Journal of Heat and Mass Transfer, Vol. 20, No. 11, pp. 1185-94, November 1977.
- Smith, L., and de Waard, K., “Corrosion Prediction and Materials Selection for Oil and Gas Producing Environments,” 16th International Corrosion Congress, Beijing, Sept. 19-24, 2005.


