Study evaluates link between environmental performance, profits of Canadian refiners
A study conducted on the Canadian refining industry for 1993-2003 showed a positive correlation between environmental performance and profitability. For every 1 tonne decrease in emissions, the income from refinery operations increased by about $2,000 (Can.).
Public concern for the environment has triggered new regulations and increased stakeholder expectations. Both have triggered costs that profoundly affect the petroleum-refining sector.
There are two competing views on the overall impact of environmental spending on profitability. One says that pollution-abatement efforts divert resources from the production of marketable output and lead to a decline in profits. The other says that environmentalism has led to modernization of operations and better management, which together result in higher profits.
This article examines the correlation of Canadian petroleum refinery profits with the volume of reported pollutant emissions. These emissions are reported to the Canadian government and are available to the public in Environment Canada’s “National Pollutant Release Inventory,” (NPRI).
We examined the correlation of emissions with profit for a 10-year period beginning in 1993.
Petroleum refineries play a significant role in the Canadian economy. They have a high public profile among environmental groups and are frequently targeted for regulation. The costs that result from these regulations can be difficult to assess. They are known, however, to be substantial.
In 1993, for example, the National Petroleum Council estimated the cost for refineries to satisfy environmental regulations in the US were $152 billion.1 Purvin & Gertz estimated the cost of Canadian sulfur-reduction regulations for gasoline and diesel products alone to be $5.3 billion (Can.).2
Previous studies
Other studies have examined the environmental vs. financial performance question in a variety of industries, with mixed results.
For example, pollution abatement reduced productivity in both the brewing industry and the electrical utilities industry.3 4
Freedman and Jaggi found no evidence to support claims that it hurt profitability in the pulp and paper industry.5 On the other hand, Spicer found that better pollution control was associated with higher profitability for pulp and paper companies.6 Russo and Fouts argued that some of these earlier studies can be challenged on methodological grounds because they failed to control for factors that contribute to profitability.7
Some have argued that cross-sectional studies such as these are rooted in time and are therefore unable to capture the effects of technological advances.
Our study, funded by Ryerson University, Toronto, is designed to address both concerns by exploring the long-term relationship of profit and environmental performance in refineries, while controlling for the main cost of those operations.
Although there are many factors that affect the profitability of refineries, and many studies about them, much of the information is proprietary. Empirical evidence, therefore, about the relationship between economic and environmental performance remains largely unknown.
Model definition, data
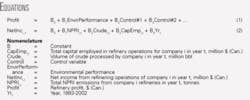
A rough configuration of the statistical model for this study is shown in Equation 1 (see equation box).
Earlier studies from other industries use a variety of measures for the EnvirPerformance variable. These measures include the number of environmental charges a company has faced, the number convictions a company has faced, the size of monetary penalties, and the direct cost of complying with regulations.
Each measure has its limitations. The number of charges, for example, is due as much to regulatory enforcement efforts as to company actions and therefore may not truly measure how managers are addressing environmental concerns. Fines and convictions are due to enforcement efforts too, as well as to companies’ efforts to defend themselves in court. For this reason, neither infractions nor fines and convictions fully reflect the pervasive impact on operations of the environmental movement.
Compliance costs of regulations might be a better proxy, but the data are not easily obtained. Compliance costs are not easily identified, even with access to proprietary information. For example, managers at an Amoco refinery in Virginia initially believed the cost of complying with environmental regulation was about 3% of non-crude operating costs. A 2-year study reassessed the figure at 22%.8
Furthermore, shareholders have reacted when companies respond to environmental concerns, even when regulatory action is not involved. Spicer’s study showed that pulp and paper companies with better pollution control records have higher price-earnings ratios, and lower share price volatility than companies with poor records.6 Klassen and McLaughlin found that share prices rise when companies win awards for exemplary environmental management.9
It is a matter of speculation as to whether these capital market responses mean investors are expressing concern that current (legal) behavior may in the future be challenged by expanding regulation, or whether they are expressing their personal values. Nevertheless, these results argue in favor of a measure of environmental performance that goes beyond regulation or the cost of compliance, to include voluntary efforts as well.
King and Lenox examined the correlation of financial performance with toxic release inventory emissions in their study of US manufacturing companies. They found a positive correlation of financial performance with waste prevention.10
We therefore decided to use NPRI emissions as the measure of environmental performance.
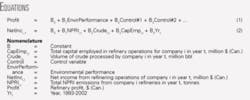
Equation 2 shows the final model that we used in our analysis.
Total refining capacity in Canada was about 1,855,850 b/d in 2003. There were 19 petroleum refineries in Canada at that time, owned by 10 companies. This excludes refineries classified as upgraders, as well as petrochemical plants.
Of the 19 petroleum refineries, those operated by private companies were eliminated from the study because of the difficulty in obtaining financial performance data. Refineries fully owned by US companies were also eliminated to avoid complications that could arise from the differences between US and Canadian financial reporting guidelines.
Data were collected from these six companies that operate 15 refineries:
- Husky Energy Inc., 2 sites.
- Imperial Oil Ltd., 4 sites.
- Parkland Industries Ltd., 1 site.
- Petro-Canada, 4 sites.
- Shell Canada Ltd., 3 sites.
- Suncor Energy Inc., 1 site.
Using data from these 15 refineries, our study estimated the long-term correlation between profit and pollution based on data representing over 60% of total refinery capacity in Canada.
All of the data used in this study came from publicly available documents. Emissions volumes came from the Environment Canada NPRI database. Financial data and feedstock volume data came from the companies’ annual reports.
There were limitations in the data available from some of the companies, and some of the data required estimation. Husky, for example, did not become a publicly traded company until 2000. Husky’s annual reports contained sufficient historic information to provide data for 2000-02 only.
Parkland Industries, the smallest company in the sample, required special treatment. Because Parkland sold its refinery in 2000, only 8 years of data were available for this company. Furthermore, Parkland’s main business was marketing gasoline, which distinguished it from the larger, integrated oil companies. Parkland did not disclose petroleum refinery operations as a separate segment. An estimate of NetInci,t for Parkland Industries was based on the proportion of sales volume for which cost of sales was produced internally.
The other control variable was CapEmpi,t. This was measured as the cost of refinery assets less accumulated amortization. Integrated companies provided this information in their segmented disclosures. For Parkland, the information came directly from the balance sheet.
The time factor Yrt is included in this study as a trend variable, serving to capture the effect on NetInci,t of factors that may correlate with downstream profit yet remain unidentified, or for which the information is unavailable.
Energy efficiency, for example, is a key factor in determining refinery profitability. The energy efficiency of each refinery is assessed with Solomon’s Energy Intensity Index. These numbers, however, are considered confidential business information by each refiner and are only released to the public as an annual aggregate. Because these energy intensity numbers, however, were highly correlated with Yrt, we decided simply to use the latter as a sort of “catch all” trend variable.
The final data set included 51 company-years. A statistically significant and negative emissions factor would support King and Lenox’s evidence of a positive correlation between financial and environmental performance. On the other hand, a significant and positive coefficient would support the “dead loss expenditure” view that environmental legislation creates new costs for refiners while adding nothing to the bottom line.
Study findings
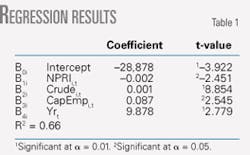
Table 1 shows the regression results. All control variables are statistically significant at α = 0.05 or less. About 66% of the variation in NetInci,t is explained by variation in the independent factors identified in this model. The key independent variable NPRIi,t is statistically significant at α = 0.05 and is negative.
These results argue that when aggregate NPRI emissions drop by 1 tonne (while controlling for size of operation and volume of crude), the income from refinery operations rises by about $2,000 (Can.).
This model is designed to test for correlation, not causation. We cannot, therefore, conclude that a reduction in emissions means that profits will increase. Nevertheless, these results provide evidence that the “dead-loss expenditure” argument does not fully capture the impact of the environmental movement on the refining industry.
An explanation for these findings is not immediately obvious. After all, environmental regulations have increased the cost of doing business. One possible explanation is that when operations are modernized to meet environmental control requirements, plant operating efficiencies are also enhanced with technology and innovation.
Furthermore, the correlation between these two performance measurements-profit and emissions-is caused, at least partially, by external factors such as societal expectations. This makes sense in the face of public demand for cleaner technologies, especially in an oil and gas industry that seeks to be publicly accountable for its activities.
There is, however, no clear cut evidence that “lean” (lower costs, higher profitability) and “green” (environmental performance) are complementary objectives. It is possible that both trends-falling emissions and rising profits-could be occurring anyway, caused by unrelated factors excluded from the analysis.
Data used in a cross-sectional study are anchored at a fixed point in time. This was mentioned earlier as one of the criticisms of previous research. The current study pooled cross-sectional with time series data to avoid this constraint.
Time plays a major role in the relationship between financial and environmental performance in several ways. First, concern for the environment has grown as our economies have matured, along with our understanding of the long-term effects of business activity on the ecosystem and of the effects of environmental change on human health. Second, technological change is itself a function of time.
Finally, Russo and Fouts found the relationship of environmental performance with profit to be strongest in those industries that are in a growth phase.7 This makes sense, given that these are the industries in which investment in new technology will be the greatest.
Our dependence on certain industries, which distinguishes those that are growing from those that are mature, or dying, depends itself upon time. Despite the maturity of this sector, refineries have a long history of continued technological innovation in both core refining processes and products. This trend is evident in increases in annual capital investments by existing refineries over the long term (25+ years) to ensure these plants remain economically viable in a very competitive sector.
This study was subject to numerous limitations and many questions remain unanswered. We did not try, for example, to test whether the best environmental performance (lowest emissions) is associated with the best financial performance. An examination of this nature would be a logical extension to this research, and a positive finding would support the conclusion that a competitive advantage is available through effective and improved environmental control.
The industry in Canada is small, which made it difficult to obtain sufficient data for a thorough analysis. Furthermore, we had to estimate some of the data when they were not provided directly in the annual reports. This contributed to potential measurement error in the variables.
Finally, the choice of NPRI emissions as the proxy for environmental performance introduced a host of problems. The refineries are not homogeneous in their range of emitted substances. The list of NPRI reportable substances was not constant. This was particularly notable in 2002, when the aggregate emissions for each refinery spiked up sharply, due to additions to the list of reportable substances.
All of this suggests that a better analysis would be possible if more finely specified data were available. For example, a study that focused on a smaller number of substances that all refineries (or at least all companies) report each year would strip out the variability introduced by the additions to and deletions from the NPRI reportable substances list. The use of site-specific energy intensity numbers, along with site-specific profit figures, would enhance the internal validity of the model and increase the usefulness of the findings.
Acknowledgment
The authors acknowledge and thank Bruce Orr, Canadian Petroleum Products Institute, for his helpful support in providing industry perspective and context during preparation of this report.
References
- “U.S. Petroleum Refining: Meeting Requirements for Cleaner Fuels and Refineries,” National Petroleum Council, Washington, DC, August 1993.
- “Economic and Environmental Impacts of Removing Sulphur from Canadian Gasoline and Distillate Production,” Draft report prepared for the Canadian Petroleum Products Institute, Natural Resources Canada, Environment Canada, and Industry Canada, Purvin & Gertz Inc., Houston, June 2, 2004.
- Smith, J., and Sims, W., “The Impact of Pollution Charges on Productivity Growth in Canadian Brewing,” Rand Journal of Economics, Autumn 1985, pp. 410-23.
- Gollop, F., and Roberts, M., “Environmental Regulation and Productivity Growth: The Case of Fossil-Fueled Electric Power Generation,” The Journal of Political Economy, Vol. 91 (1983), pp. 654-74.
- Freedman, M., and Jaggi, B., “An Investigation of the Long-Run Relationship between Pollution Performance and Economic Performance: The Case of Pulp and Paper Firms,” Critical Perspectives in Accounting, Vol. 3 (1992), pp. 315-36.
- Spicer, B., “Investors, Corporate Social Performance and Information Disclosure: An Empirical Study,” The Accounting Review, Vol. 53 (1978), pp. 94-111.
- Russo, M., and Fouts, R., “A Resource Based Perspective on Corporate Environmental Performance and Profitability,” Academy of Management Journal, Vol. 40 (1997), pp. 534-59.
- “Environmental Accounting Case Study: Amoco Yorktown Refinery,” D.W. Ditz, J., Ranganathan, and R.D. Banks, editors, Green Ledgers: Case Studies in Corporate Environmental Accounting, World Resources Institute, 1995.
- Klassen, R., and McLaughlin, C., “The Impact of Environmental Management on Firm Performance,” Management Science, Vol. 42 (1996), pp. 1199-1214.
- King, A., and Lenox, M., “Exploring the locus of profitable pollution reduction,” Management Science, Vol. 48 (2002), No. 2, pp. 289-99.
The authors
Vanessa Magness ([email protected]) is an associate professor of accounting at Ryerson University, Toronto. She has also taught at York University, the University of Toronto, the University of Manitoba, and Keyano College, Alta., Canada. Her research focus is accounting for environmental information and managing environmental costs. Magness holds a Bachelor in Administrative Studies (1983) from York University, an MBA (1992) from the University of Toronto, and a PhD (2000) from the University of Manitoba. She is a member of the Society of Management Accountants of Ontario.
Natasha Tang Kai was formerly a research assistant in the Master of Environmental Applied Science and Management program at Ryerson University, Toronto. Her graduate research focused on the development of a spill management framework for land-based oil spills in the Caribbean. She has served as a program analyst at the Ontario Ministry of Natural Resources and Environment; she is currently a senior advisor at the Ministry of Research and Innovation. Tang Kai holds an undergraduate degree in environmental studies from York University, Toronto.


