Understanding of the unconventional-gas resource base has improved in the past decade, but many unknowns remain.
Data from drilling more than 100,000 wells and developing 120 tcf of reserves in the past 10 years have provided a more solid foundation for estimating the resource potential of tight gas sands, coalbed methane, and gas shales.
Yet questions remain, such as:
- Where are the productive limits of the emerging gas plays?
- What is the optimum well spacing?
- How will advances in well drilling and completion technologies change well productivity?
Because of these questions, estimates of the recoverable portion of the large in-place unconventional-gas resource may change many times during the next decade.
This second in a six-part series on unconventional gas, discusses the size and nature of the resource base including why and how the estimates of recoverable resources may change and evolve.
The first article in this series (OGJ, Sept. 3, 2007, p. 35) covered the growth of these resources during the last decade.
Resource base estimate
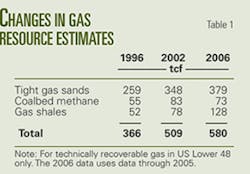
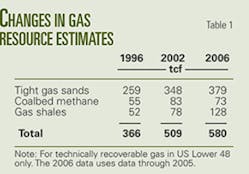
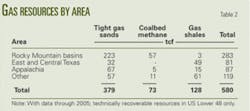
Advanced Resources Inc. estimates that the recoverable resource base for unconventional gas is large, about 580 tcf-with 379 tcf in tight gas sands, 73 tcf in coalbed methane, and 128 tcf in gas shales. Table 1 shows ARI’s unconventional-gas resource base estimates for technically recoverable resources in 1996, 2002, and 2006, and Table 2 provides regional detail for the 2006 resource estimate.
The tight-gas-sand play in the Rocky Mountain basins forms the largest segment of the unconventional-gas resource, followed by the gas shales and tight gas sands of the Appalachia basin. The fastest growth in unconventional-gas resources has been in East and Central Texas, with the emergence of the Barnett gas shales and the Cotton Valley-Bossier tight gas sands.
When looking at the resource base numbers, it is important to remember that these estimates are merely a “snapshot in time.” The continuing emergence of new unconventional-gas plays, the ability to develop an already discovered play more intensively, and advances in extraction technology can and will affect the ultimate size of the recoverable resource.
The statement “we do not yet know the true size and nature of the unconventional gas resource base” is as true today as when it was made 9 years ago.1
Resource pyramid
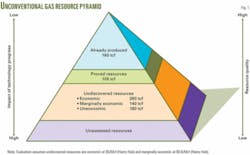
One useful way to view the size and nature of the unconventional-gas resource base is as a resource triangle or pyramid (Fig. 1).1 2 The top of the pyramid contains high quality unconventional-gas plays and portions of plays, many of which are extensively developed. These higher quality plays have produced 160 tcf and still hold 105 tcf of proved reserves.
The middle of the pyramid contains 260 tcf of economic and 140 tcf of marginally economic undeveloped unconventional-gas resources. At the bottom of this section are about 180 tcf of lower quality, uneconomic plays, and portions of active plays, such as the basin margins.
The base and inside of the pyramid, still out of view, contain the new, still to be assessed and discovered unconventional-gas plays.
The unconventional-gas plays within the resource pyramid are dynamic. The resources can move vertically with progress in technology and knowledge, from an initial low quality, high-cost foothold to a position of higher quality. An example of this is how application of horizontal wells and multistage hydraulic fracturing has enabled gas shales plays to become “the new hot thing.”
Exploration and new resource appraisals can accelerate development of the still unassessed unconventional-gas plays inside the pyramid.
Resource base estimates
Need for new evaluation methods, a massive data volume, and rapid changes in outlook make assessing the size and quality of the recoverable unconventional gas difficult.
The assessment requires new methods because of the continuous nature of the unconventional-gas deposits. Analysts cannot use traditional methods developed for conventional gas, such as field size distributions, finding rates, and a discovery process. The assessment involves vast quantities of geologic, engineering, and well performance data plus numerous “expert judgment” calls. For example, ARI periodically reviews the performance of several hundred thousand unconventional-gas wells to establish up-to-date trends in well productivity.
Unconventional-gas plays also are prone to rapid and large changes in performance. Successful introduction of new geologic knowledge and advances in well drilling and completion practices can dramatically improve a play’s outlook.
A prime example is how horizontal drilling, restimulation, and closer well spacing converted the Barnett shale from a 3-tcf marginal gas resource (as evaluated by the US Geological Survey in 1996)3 to a major 26-49 tcf gas play as determined in an ARI internal assessment. The ARI estimate for the Barnett shale differs from the USGS assessment in that it includes expectations for gas recovery from drilling horizontal wells in extensions of the core areas.
At the same time, as an unconventional-gas play matures, its well productivity and success rate will start declining unless technology can outpace resource depletion.
Resource assessment steps
Because unconventional-gas resources are dynamic, the plays need frequent reassessment, every 2-3 years, not once per decade. ARI’s preferred resource assessment method for continuous gas plays has five key steps:
- Gas in-place and play area. Establish the play outline using various measures such as thermal maturity or minimum net pay and than map the gas-in-place contours to define the ultimate resource target and establish the quality portions of the gas play.
- Well drainage and spacing. Use production data, reservoir properties, and a tight formation type-curve model, such as METEOR, to establish analytically rigorous well drainage. In addition, examine oil and gas commissions’ spacing rules appropriate for each play.
- Trends in well performance and success rates. Assemble a comprehensive, accurate, and up-to-date database of well performance, reserves per well, and success rate for key time periods to understand resource maturity and the impacts of technology advances.
- Trends in technology progress. Document how progress in technology, such as pay selection and well-completion practices, has improved or may continue to improve well performance. Selected field case studies plus in-depth technical performance data can provide valuable insights on the performance and benefits of improved technology.
- Higher quality and accessible play partitions. Use the empirical well performance database plus basin modeling, stress mapping, and other methods to define the higher productivity portions of the plays, particularly areas with greater permeability. In addition, examine federal and state regulations to establish the portion of the basin that may or may not be accessible in the foreseeable future
The first assessment step can be established from geologic maps but requires judgment as to where to draw the “quality” gas play outline. The next two assessment steps can be empirically established from drilling and production data. The fourth assessment step requires assembling considerable technical information and rigorous case studies. The greatest uncertainty and expert judgment is in step five-determining the portion of the unconventional-gas play that can be accessed and is of sufficient quality to be developed in the foreseeable future.
Resource estimate comparison
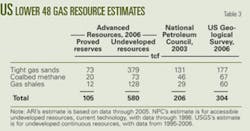
Table 3 compares three estimates of the recoverable portion of the unconventional-gas resource base.
ARI’s 2006 estimate used annual updates on unconventional drilling, production, and reserves. The 580 tcf unconventional-gas resource estimate is, at times, considered aggressive in that it incorporates expectations of technology progress and intensive resource development. To note, however, is that ARI’s 10-tcf estimate for the Barnett shale in 1998 also was considered aggressive at the time.1
The National Petroleum Council (NPC) estimate used a combination of Gas Research Institute and USGS data, industry reviews, and outside contractor input. Its latest study, completed in 2003 with resource base data through 1998, determined that the US Lower 48 states had an accessible unconventional resource base of 206 tcf.4
USGS has reassessed 22 priority basins and has plans to reassess 10 more basins since its last comprehensive assessment in 1996. The current USGS estimate for the Lower 48 is 304 tcf of unconventional-gas resources.5 6 Its assessment method combines use of total petroleum systems and cell-based resource estimates, involving play area, well density, well productivity, success rate, and play access.
To note is that the USGS has yet to include in its estimate the continuous gas resources in many large basins, such as Anadarko, Big Horn, and East Texas.
In another assessment, the US Energy Information Administration uses a combination of USGS and ARI data and contracts with ARI for annual updates to tight gas reserves, drilling, and production estimates. These input data are incorporated into EIA’s UGRSS module of its Oil and Gas Supply Modeling system.
Estimate differences
Given the different assessment methods, data, and assumptions included, it is not surprising that estimates of the remaining unconventional-gas resource base vary. What is surprising is that the differences, both overall and for any given play, are so large.
The reason one should care about these difference is that accurate assessments are important in assisting industry to target its efforts better and in aiding government policy makers in arriving at better decisions. For example, it matters greatly whether the remaining accessible unconventional-gas resource base is 580 tcf as of today (ARI) or 206 tcf as of 1998 (NPC).
ARI’s play-by-play tabulation shows that in the 7 years 1999-2005, industry had developed 100 tcf of undiscovered unconventional-gas resource. If the accessible resource base is 206 tcf (as of 1998), then only 106 tcf remain undeveloped as of the end of 2005.
The implication is that the remaining unconventional resource base may not support current production levels for much longer. With declines in conventional gas production, both onshore and offshore, a severely depleting unconventional-gas resource base would require massive gas imports, particularly LNG, for averting a gas supply crisis.
If the remaining unconventional-gas resource base is 580 tcf, however, the industry has a good potential for maintaining today’s domestic natural gas production rates, with advances in technology potentially providing additional production.
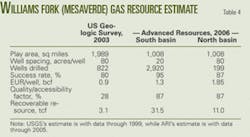
It also matters whether a particular unconventional-gas play has only 3 tcf or more than 40 tcf of remaining undeveloped resource. For example, as shown in Table 4, two resource estimates exist for the Williams Fork (Mesaverde) lenticular tight gas play in the Piceance basin. USGS with data through 1999 shows 3.1 tcf, while the ARI estimate with data through 2005 shows 42.5 tcf.
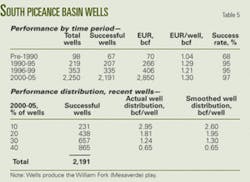
The play has 2,250 wells drilled and 2.85 tcf of resource developed since 1999 (Table 5). The USGS estimate would then indicate that this play is essentially over, while the ARI estimate indicates that the industry has only started to develop this play.
The Williams Fork (Mesaverde) tight-gas play in the South Piceance also illustrates how modest differences in assumptions can lead to resource estimates that differ widely (Table 4).
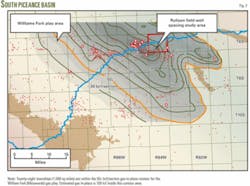
In regard to basin area, both the USGS and ARI use essentially the same area for the basin, about 2,000 sq miles. ARI divides the basin into two distinct segments: the North and the South. For the southern segment, ARI prepared a gas-in-place contour map and used the 50 bcf/section contour to define the quality portion of this gas play (Fig. 2).
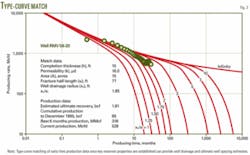
USGS used an average spacing of 80 acres/well and ARI used 20 acres/well based on recent Colorado Oil and Gas Commission (COGA) rules allowing such well spacing. ARI also type-curve matched production data to establish well drainage, confirming the validity for using 20-acre well spacing. Fig. 3 shows a type-curve for a 15-acre well drainage area for Well RMV 58-20, which is representative of the play.
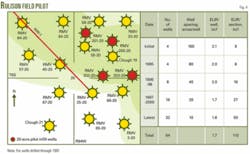
ARI also evaluated the intensive resource development in Rulison field, Section 20 (T6S R94W). This pilot section for infill development of this tight-gas-sand play showed that gas recoveries of more than 110 bcf/section are possible with even closer 10-acre well spacing (Fig. 4).
Both the USGS and ARI use high success rates because most South Piceance wells are infill wells.
USGS estimates a 0.9 bcf/well ultimate recovery, while ARI estimates a 1.3 bcf/well recovery for South Piceance and a 1.85 bcf/well recovery for North Piceance. ARI’s higher assessment is due to recognizing that improved technology is being used in new wells and that older wells are being recompleted. The USGS acknowledges that “the EUR’s presented in this report (Uinta-Piceance Province) represent current completions only, and do not include the anticipated production potential for behind pipe gas that is not yet being produced. When this is added, the EUR’s should be considerably higher...,” citing Reference 7.
The USGS well database is current as of 1999 and contains 822 wells, while the ARI well database is current as of 2005 and contains 2,920 wells.
Table 5 illustrates the time-slice method used by Advanced Resources for establishing success rates and recovery per well for this tight gas play. This table shows:
- All wells drilled and completed by key time periods, to isolate basin maturity (depletion) and technology progress.
- Trends for well performance, the distribution of current well performance, and trends in well success rates.
A major assessment uncertainty exists for determining the portion of the play that can and will be developed in the near future. USGS assumed that industry will develop only a relatively small portion of available drill sites in 30 years and applied a 28% quality-accessibility factor to the play. ARI, after mapping the high gas-in-place portion of the South Piceance basin and examining the federal leasing regulations for this basin, used an 87% quality-accessibility factor.
This discussion provides an insight into the difficulty in making resource assessments for unconventional gas and why these resource assessments may differ. Clearly, assembling and rigorously using up-to-date well performance data are important. As important is using appropriate well spacing and expectations for resource access and development for these large, continuous-type resources.
Frequent updates
Improvements in technology and knowledge rapidly can change the outlook for unconventional-gas plays. To see these changes requires frequent assessments, particularly for resources where technology progress is helping unlock a gas play.
A prime example is the Williams Fork (Mesaverde) play where multizone stimulation and new understanding of reservoir geometry has led to better well performance and has justified several rounds of downspacing, resulting in a substantial increase in the recoverable resource base.
The knowledge gained from such assessments is vital for guiding industry investments and for formulating a sound energy and natural gas policy.
References
- Kuuskraa, V.A., Schmoker, J.W., and Dyman, T.S., “Emerging U.S. Gas Resources-Conclusion, Diverse Gas Plays Lurk in Gas Resource Pyramid,” OGJ, June 8, 1998, pp. 123-30.
- Masters, C.D., Root, D.H., and Dietzman, W.D., “Distribution and quantitative assessment of world crude oil reserves and resources,” Proceedings of 11th World Petroleum Congress, Vol. 2, 1984, pp. 229-37.
- Schmoker, J.W., Quinn, C.J., Crovelli, R.A., Nuccio, V.F., and Hester, T.C., “Production Characteristics and Resource Assessment of the Barnett shale Continuous (Unconventional) Gas Accumulation, Fort Worth basin, Texas,” USGS Open-File Report 96-254, 1996.
- Balancing Natural Gas Policy: Fueling the Demand of a Growing Economy, National Petroleum Council Committee on Natural Gas, September 2003.
- 2004 Assessment of Undiscovered Oil and Gas Resources of the Bend Arch-Fort Worth basin Province of North-Central Texas and Southwestern Oklahoma, USGS Fact Sheet 2004-3022 from http://pubs.usgs.gov/fs/2004/3022/fs-2004-3022.pdf.
- National Assessment of Oil and Gas Resources Update, USGS, December, 2006, from http://energy.cr.usgs.gov/oilgas/noga/ass_updates.html.
- Naturally Fractured Tight Gas Reservoir Detection Optimization, Final Report for DOE/METC, Contract Number: DE-AC21-93MC30086, Advanced Resources, 1997.
