SPECIAL REPORT: Study calls for pipeline filler metal improvement
Filler metals for 36Ni alloy cryogenic pipeline construction need further refining to obtain overmatching mechanical properties relative to the base metal.
This article provides an overview of mechanical properties for commercially available filler metals for 36Ni alloy construction, helping determine loading limits and performance capabilities of the various filler metals available. Two of the alloys tested meet the specified property values, but none overmatched both the tensile and impact properties of the base metal at room and cryogenic temperature.
Background
Operators of LNG loading terminals want to change loading pipeline design from the standard jetty-based stainless steel to a subsea 36Ni alloy-based design. Changing pipeline materials from stainless steel to a 36Ni alloy would allow elimination of the jetty structure and expansion loops in favor of a straight subsea pipeline, decreasing the materials required, reducing environmental disturbance, and increasing the security of the pipeline.
The 36Ni’s low coefficient of thermal expansion, about 10 times lower than stainless steel, allows these improvements, decreasing thermal stresses that arise when the pipeline is cooled from ambient to operating temperature. Traditional LNG offloading lines compensate for these thermal stresses by including mechanical expansion loops and bellows that can deflect with the thermal stresses. Moving away from the traditional method could reduce operating expenses of the LNG offloading terminal by extending the LNG pipeline to deeper water, reducing the amount of required loading berth access dredging.
Development of 36Ni as a pipeline material is ongoing. Determining a weld filler metal for both pipe fabrication in the mill and pipeline installation in the field that can withstand the stresses from installation and service is a critical component of this work. This article aims to identify an existing filler metal class that meets these needs.
Table 1 lists the five commercially available weld filler wires selected. These filler wires fall into two general categories:
- Matching coefficient of thermal expansion properties.
- Enhanced mechanical properties.
The matching CTE filler metals match the base metal chemistry (36%Ni/bal.Fe) and thus the base metal CTE. The enhanced mechanical property filler metals add alloy elements to improve mechanical strength but also increase the CTE.
The design of matching CTE filler metals focused on applications where CTE matching with the base metal was critical. The enhanced mechanical property filler metals address applications where load-bearing conditions require a filler metal that possesses thermal properties close to the base metal, but where mechanical strength is of primary importance.
A higher weld strength than the base metal yields the preferred case, allowing structures to be designed with the base metal properties as the limiting factor
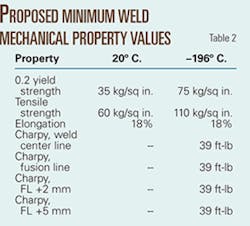
Table 2 lists proposed minimum weld mechanical properties.
Experimental procedure
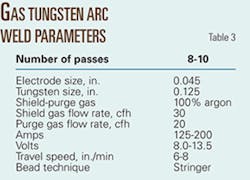
A series of plate butt welds provided mechanical test samples to investigate the properties of a variety of commercially available filler metals. All weld wires listed in Table 1 were subjected to gas tungsten arc welds. Table 3 lists the welding parameters for the GTAW welds. Welding the C filler metal via a GMAW process as well determined the effect of the welding process on weldment mechanical properties.
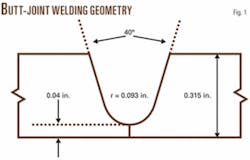
Fig. 1 illustrates the weld bevel geometry.
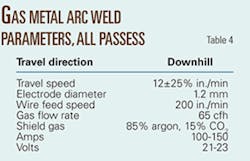
Table 4 lists the GMAW welding process parameters.
Mechanical tests of the welds complied to requirements similar to those in DNV Offshore Standard DNV-OS-F101, Appendix C, Section F as a basis for weld consumable comparison.1 The following analytical methods studied the 36Ni weldment mechanical properties.
Tensile testing
Tensile tests recorded the stress-strain curve of the solidified weld metal as well as the composite weldment.
Round tensile bars (6-mm gauge diameter) machined from the solidified weld pool characterized the all-weld metal samples according to ASTM A370.2 Tests used four tensile samples per filler metal, two each at room temperature and at -196° C., encompassing the full range of temperatures to which the materials would be exposed during construction and service.
Table 2 lists the minimum values regarded as acceptable, recording values of 0.2% yield stress, tensile stress, and elongation.
Flat bar samples machined from the base metal with the weld oriented normal to the sample length characterized the tensile properties of the complete weldment. Removing the weld reinforcement cap from these samples gave dimensions consistent with ASME IX,3 reporting values of 0.2% yield stress, tensile stress, and elongation.
Impact testing
ASTM E 23 guided Charpy impact tests on each of the welds at -196° C to measure the weldment toughness under simulated service conditions.4 Samples prepared from each weld located the sample notch at the weld center line, weld fusion line, 2 mm into the base metal, and 5 mm into the base metal. Separate Charpy impact tests on the base plate compared it to the welded samples, testing three samples at each location.
Table 2 lists the minimum energy absorbed as 39 ft-lb at -196° C.
Bend testing
Bend testing sample lengths of the welds with both the weld root and weld face exposed tested ductility according to ASME IX,3 bending the samples through 180° over a 4T radius and accepting or rejecting samples based on the presence of surface cracks.
Thermal expansion
Section 10 of ASTM E8315 provided the basis for testing the thermal expansion properties of the weld materials across a temperature range of -193 to 22° C.
Metal cracking
Matching 36Ni filler metals exhibit ductility dip cracking in multipass welds such as those used in this article.6-10 Metallographic samples examined the weld cross sections for cracking evidence within the weld material via scanning electron microscopy at ExxonMobil Research and Engineering Co.’s Corporate Strategic Research Laboratory, Clinton, NJ.
Base metal
The tensile stress, 0.2 yield stress, elongation, and Charpy-impact energies recorded at room and cryogenic temperatures parallel to and normal to the rolling direction for the unwelded base plate compared the weldment properties to those of the base metal.
Results
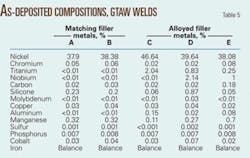
Table 5 lists spectroscopically analyzed as-deposited weld compositions.
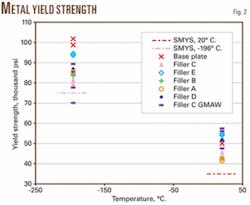
Fig. 2 shows the yield strengths of the filler wires and base plate at room temperature and at -196° C. A horizontal line at both temperature marks the specified minimum yield stress at 0.2% offset. At room temperature, filler metals C GMAW, D, and E meet or slightly exceed the base metal yield strength, while filler metals A, B, and C GTAW undermatch the base metal. All filler metals undermatched yield strength in cryogenic tests. Data for filler metal C GMAW have significantly more scatter at both temperatures than GTAW process results.
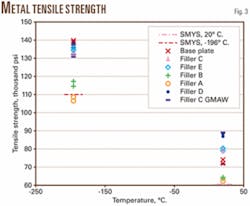
Fig. 3 illustrates tensile strengths of the filler wires and base plate at room temperature and at -196° C. A horizontal line shows specified minimum tensile strength at both temperatures. Room temperature data show that filler metals C GMAW, C GTAW, D, and E exceed the tensile stress of the base metal. At -196° C. only D matches the tensile stress of the base metal. All other filler metals undermatch. Filler metal A does not meet SMTS.
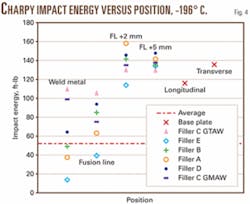
Fig. 4 presents the energy absorbed vs. the Charpy notch location for the weld filler metals at -196° C. The Charpy notch location varies from the weld center line through the fusion line into the base metal. A general decrease in toughness emerges from the base metal into the weld metal. Only filler metal C’s toughness values remain relatively constant across the weld and heat-affected zone.
The E filler metal failed to meet specified minimum toughness values.
All filler metals passed the bend test with no cracking evidence on the face or root of the weld.
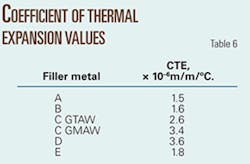
Table 6 lists the measured values of CTE for the weld filler metals. These values fall into two groups:
- Those that closely match the 1.6-1.8 x 10⁻⁶ m/m/ºC. CTE of the 36Ni base metal (filler metals A, B, and E)
- Those that have about twice the value of the base metal CTE (filler metals C and D).
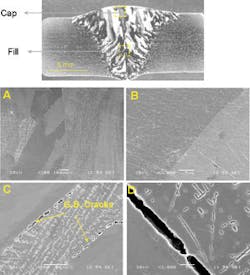
Examining the weld microstructures of filler metals C GTAW, C GMAW, D, and E found that they did not exhibit ductility dip cracking. Filler metals A and B did. Fig. 5 shows a representative microstructure of a cracked weld pool. Cracked samples had a crack-free final cap pass.
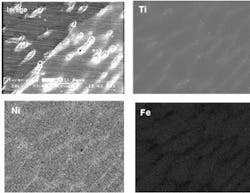
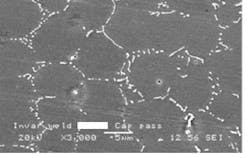
Examination of the the alloyed filler metals by scanning electron microscope uncovered secondary phases. The energy dispersive x-ray spectroscopy SEM images of Fig. 6 show an example from filler metal C. The greater brightness of these images shows higher composition of the element mapped.
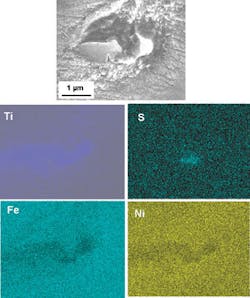
Fig. 7 shows a high-magnification image and x-ray spectroscopy mapping of a single particle from Fig. 6. The titanium-rich particle is also rich in sulfur.
Fig. 8 shows NbC particles found decorating the grain boundaries of filler metal E’s fusion zone.
Figs. 2-4 show that the goal of overmatching baseplate mechanical properties at both cryogenic and room temperatures was not uniformly achieved with any of the filler-metal alloys. Certain filler metals would match or overmatch for one property but not another or overmatch at one temperature but not the other.
CTE-matching filler metals A and B showed ductility dip cracking. Filler metal A showed 50% of its grain boundary area cracked, while filler metal B had 90% of its fusion zone grain boundaries cracked, evinced by the presence of 10-500-μm cracks on the grain boundaries of the fusion zone in Fig. 5C and 5D. These cracks lie within weld passes that are reheated by subsequent welding but are not present in the final cap pass.
Examining the as-deposited weld compositions in Table 5 can explain the formation of these cracks. Literature links ductility dip cracking to the sulfur and phosphorus content of the fusion zone.6-9 One study found ductility dip cracking to increase dramatically when phosphorus content was above 0.004%.8 Table 5 shows that all of the weld pools contained phosphorus at levels of 0.007% or more, yet only CTE matching filler metals A and B cracked.
None of the enhanced mechanical property filler metals showed ductility dip cracking.
Figs. 6 and 7 show second-phase titanium-rich particles of filler metal C not present in the microstructures of matching CTE filler metals A and B. These titanium-rich particles absorb the tramp elements that cause the cracking seen in filler metals A and B. Filler metal E, while exhibiting no ductility dip cracking, showed very low toughness (Fig. 4).
Very high niobium and carbon levels in the weld pool (Table 5) cause NbC particles to form on the weld grain boundaries (Fig. 8). While NbC particles are advantageous for certain applications, in large amounts these hard particles act to decrease weld toughness.
Among the five tested alloys, two filler metals-C and D-exceeded all specified minimum criteria and passed the weld-cracking test. Filler metal C showed the most consistent Charpy v-notch toughness values, but its yield strength was one of the lowest. Filler metal D showed the highest tensile strength values, overmatching at room temperature and matching plate values at cryogenic temperature. Its toughness values, however, showed a sharp decrease at the weld center line.
The welding detailed in Tables 3 and 4 was designed to provide the highest quality and consistency for comparison among different weld metals and not to obtain the highest mechanical properties for individual filler metals. Further refinement could improve individual mechanical properties, as evinced by comparing GTAW and GMAW for filler metal C.
Scatter exists in the GMAW results, shown by the nearly 20,000 psi variation in cryogenic 0.2 yield stress. The GMAW tensile stress and yield stress values, however, are generally higher than the GTAW.
Even though further welding process optimization could increase the property values of some filler metals, the overall comparison between them is valid.
This article further demonstrates the susceptibility of this alloy class to weld-cracking phenomena discussed elsewhere in the literature.6-9 The presence of ductility dip cracks precluded selection of a filler metal for cryogenic pipeline applications. The large number of weld passes (8-10) for the joint thickness (0.315 in.) may have enhanced the cracking phenomenon in filler metals A and B over that seen in an optimized welding schedule of 4-5 passes for the thickness.
Such process refinement, however, was beyond the scope of this work.
References
- DNV-OS-F101, “Submarine Pipeline Systems,” pp. 120-122, January 2000.
- ASTM A370-05, “Standard Testing Methods and Definitions for Mechanical Testing of Steel Products,” 2005.
- ASME Section IX, “Boiler and Pressure Vessel Code Qualification Standard for Welding and Brazing Procedures, Welders, Brazers, and Welding and Brazing Operators,” July 1, 2005.
- ASTM E23-06, “Standard Test Method for Notched Bar Impact Testing of Metallic Materials,” June 2006.
- ASTM E831-06, “Standard Test Method for Linear Thermal Expansion of Solid Materials by Thermomechanical Analysis,” April 2006.
- Kazutoshi, N. et al., “Hot Cracking and its Prevention in Multi-Pass Weld Metal of Fe-36%Ni Invar Alloy,” 7th International Symposium, Joint Welding Society, Kobe, Japan, Nov. 20-22, 2001.
- Kazutoshi, N. et al., “Effect of Grain Boundary Segregation of Sulfur on Reheat Cracking Susceptibility in Multi-pass Weld Metal of Fe-36%Ni Alloy,” 7th International Symposium, Joint Welding Society, Kobe, Japan, Nov. 20-22, 2001.
- Yushchenko, K.A., et al., “Formation of hot cracks in welds in welding Invar alloy,” Paton Welding Journal, Vol. 1, No. 10, pp. 724-729, 1989.
- Ogawa, T., “Weldability of Invar and Its Large-Diameter Pipe,” Welding Journal, pp. 213-226, August 1986.
- Beranger, G. et al., “The Iron-Nickel Alloys,” pp. 175-191, Lavoisier Publishing, New York, 1996.
The authors
Brian Newbury ([email protected]) is a materials specialist at ExxonMobil Development Co. in Houston. He holds BS (1998), MS (2001), and a materials science and engineering PhD (2004) degree, all from Lehigh University. Dr. Newbury is currently a member of the American Society of Materials International, American Society of Mechanical Engineers, and the American Welding Society.
Daniel Lillig works at ExxonMobil Development Co, where he provides welding and fabrication support directly to ExxonMobil’s worldwide oil and gas field construction projects. Prior to this, he worked at ExxonMobil Upstream Research Co., where his initial research involved high performance steel development, welding, and fabrication. Lillig received a BS in metallurgical engineering in 1993 and a PhD in materials science and engineering in 2000 both from the University of Illinois. He is a member of the American Welding Society, American Society of Mechanical Engineers, International Society of Offshore and Polar Engineers, and Metallurgical Society.
Paul Michael Sommerfield ([email protected]) is a subsea systems engineer at ExxonMobil Development Co. in Houston. He has also served as a materials specialist at ExxonMobil Development and as a project engineer for the Koch Specialty Plant Services division of Koch Industries. He holds a BS in mechanical engineering (2003) from the University of Houston. Sommerfield is a member of the American Society of Mechanical Engineers.
Raghavan Ayer ([email protected]) is a senior scientific advisor at ExxonMobil Research and Engineering Co., Annandale, NJ. He holds a PhD (1974) in materials science from the University of California, Berkeley. He is a member of the American Society for Materials International, the Metallurgical Society, and Microscopy Society of America.


