ENVIRONMENTAL MITIGATION-3: Limestone boulders, artificial reef modules provide seafloor mitigation
Gulfstream Natural Gas System LLC created habitat replacement sites on the Gulf of Mexico seafloor during installation of its subsea pipeline as part of efforts to mitigate its effect on both epiflora-epifauna and fish.
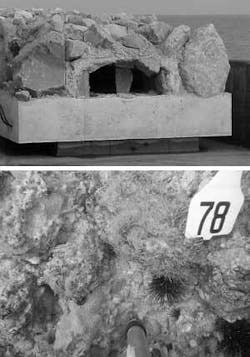
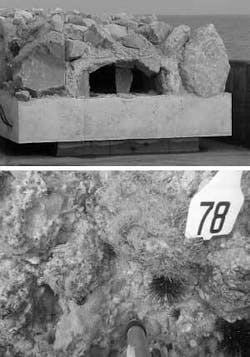
The habitat replacement sites consisted of either groupings of limestone boulders or prefabricated reef modules (Fig. 1), both of which served as substrate for live bottom community development.
The boulder sites consisted of limestone boulders spread across the mitigation area. The limestone used to construct the limestone boulder sites had specific gravity of 2.1 to 2.6 and median diameter of 3 ft. These specifications ensured that the boulders maintained their integrity when exposed to salt water dissolution. The module sites consisted of simulated reef modules arranged in a nonlinear fashion. The modules contained a minimum of 75% exposed limestone, with the remaining exposed concrete surface brushed to expose the limestone aggregate.
The spatial arrangements used in habitat placement were chosen to increase the overall benefit of the habitat. The sites selected for habitat placement were located in the vicinity of the pipeline trench, near natural live bottom areas and on sand bottom that did not exceed 0.6 m thick. Gulfstream established three limestone boulder sites (150 m × 150 m) within each of three depth zones (12-21 m, 24-30 m, and 30-60 m).
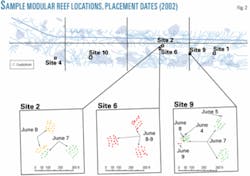
The prefabricated reef modules consisted of limestone in a concrete matrix and were also placed in 150-m × 150-m areas. A total of 153 reef modules formed three groupings of 17 modules within each of the three reef module areas (Fig. 2).
Part 2 of this article (OGJ, Jan. 8, 2007, p. 52) discussed the findings of Gulfstream’s postconstruction monitoring program, focusing on epiflora and epifauna. Part 3 of this article, presented here, evaluates the success of the habitat replacement sites in terms of both colonization by sessile epifauna, and habitat use by reef fishes. This evaluation includes:
- Comparison of epifaunal-epifloral abundance and community structure at the habitat replacement sites with unaffected live bottom reference habitat.
- Comparison of fish abundance and community structure at the habitat replacement sites with unaffected live bottom reference habitat.
The article’s conclusion will offer a detailed examination of the project’s postconstruction fish community.
Methodology
Video documentation surveys delineated live bottom areas close to the pipeline route before construction began. Entering the live bottom polygons and pipeline corridor route into a geographic information system (GIS) randomly established the reference habitat stations for biological comparisons. Unaffected live bottom polygons near the habitat replacement sites and outside of the pipeline corridor served as potential reference habitat station locations.
Epifauna-epiflora sampling
Two different types of sampling, transects and photostations, estimated the percent cover of sessile epifauna and epiflora within the habitat replacement areas and reference habitat. Transect coordinates were provided to the field survey crews, which entered them into the vessel’s navigation system before deployment. The survey vessel navigated to the coordinate locations, where divers were deployed.
In the shallowest depth zone, survey divers navigated to each transect coordinate end point and established a transect end point marker. After establishing the transect end points, survey divers measured the transect with a weighted tape measure to verify the transect length.
In the two deeper zones, survey crews provided divers with one end point coordinate and a defined azimuth for each transect. After navigating to the end point, survey divers extended a weighted tape measure 25 m along the defined azimuth and established the second transect end point.
Divers used an Olympus Camedia C-5060 wide-angle digital camera with 5.1 megapixel capacity to collect the transect photographs. An Olympus PT-020 underwater housing with a retractable rod affixed to the bottom held the camera. The retractable rod allowed divers to accurately maintain a fixed distance from the seafloor during photograph collection, providing a fixed scale for each photograph.
Divers photographed the entire length of each transect using sequential, overlapping photographs that contained a clear view of the tape measure within each frame. Survey crews established three random 25-m transects inside each habitat replacement site and reference habitat (Fig. 2).
Gulfstream established permanent photostations on three limestone boulders, two reef modules, and nine reference sites in the shallowest depth zone. Each photostation collected four photographs that were later combined as a mosaic capturing 0.707 sq m of habitat.
Photostation information collection happened in May 2005, with transect information collected in August 2005. Analysis of the photographs focused on percent biotic cover, species richness, and species diversity. Gulfstream analyzed all photostation images and 45 randomly selected photographs from each transect.
Photographic analysis followed random point analysis as described by Bohnsack. This method electronically transposes 100 random dots onto each image. It then determines percent biotal cover for a given taxon by tabulating the percentage of dots touching organisms of each individual taxon. Averaging data from individual images produces a mean for the entire photostation or transect.
Fish sampling
Gulfstream conducted nonoverlapping census counts following point count census procedures outlined in Bohnsack and Bannerot and Bohnsack et al. This protocol requires each diver-observer to census fish within a 5-m radius. Observers position themselves on the center point of the census area and wait for 3 min before recording. The waiting period allows dampening of any disturbance. After the initial waiting period, the observer identifies and counts all fish that enter the census area. For the 5-min duration of the census time, the observer slowly rotates around the center point.
Gulfstream conducted censuses in June 2005 and November 2005-January 2006 during late morning and afternoon hours. For the summer census, survey teams performed 10 counts each in the limestone boulder sites, reef module sites, and reference habitat. For the winter census, teams conducted 11 counts in the limestone boulder sites, 10 in the reef module sites, and 9 in the reference habitat.
During the winter census, Gulfstream increased the census time to 10 min at seven of the habitat replacement stations in order to determine if a 5 min census time was most appropriate. Bohnsack and Bannerot noted that more time might be required to sample species within structurally complex habitats.
A series of T-tests showed no significant differences in abundance based on the two different times for all fish species (t = -1.38, P = 0.18), demersal fish species (t = -1.09, P = 0.29, log transformed data), or commercially important species (t = -0.31, P = 0.76). Pelagic species were not observed during any of the 10-min samples, so that sampling time did not affect the count of this community component either.
These results agree with the conclusions that Bohnsack and Bannerot drew for their own study area, that a standardized 5-min sampling window provides a representative value. The use of a longer time window could lead to increased bias due to highly mobile species that are hard to distinguish as discrete visitors if they return to the sampling area. All samples, therefore, were combined for analysis, regardless of their duration.
Survey teams collected abiotic and habitat characteristics at each fish census location to assess differences between the study areas that may affect either fish populations or data collection. Teams measured surface water temperature at each sampling point. Secchi disk measurements assessed if divers had sufficient light and water clarity to conduct the fish census at each station.
Surface roughness contributes substantially to habitat complexity and was measured during the summer fish survey as rugosity. The ratio of linear distance traversed by a fixed length of chain yielded the rugosity at each station. The 9.6-m chain traversed less distance in areas with a high degree of topographic relief, showing greater rugosity.
Statistical analysis
A series of statistical tests compared epifaunal-epifloral and fish abundance and community assemblage at the habitat replacement stations to that found at unaffected hard-live bottom reference stations. Specifically, T-tests or one-way ANOVA tests addressed differences in abundance values. A nonparametric Mann-Whitney test or Kruskal-Wallis ANOVA on Ranks mitigated circumstances when assumptions of normality and heterogeneity of variances could not be satisfied with standard transformation.
If ANOVA results showed a significant p-value, a Student-Newman-Keuls (SNK) or Dunn’s multiple comparisons test was performed (α = 0.05). A Spearman rank correlation test determined if a relationship exists between fish abundance and habitat complexity (e.g., rugosity). Analysis of similarities (ANOSIM), a PRIMER v5 multivariate analysis technique, assessed differences in the community assemblage between habitat replacement types and reference stations. If ANOSIM results showed a significant difference between groups, a similarity percentages (SIMPER) analysis (another PRIMER v5 multivariate analysis technique) was run to determine which groups were most influential in creating the differences.
The SIMPER technique examines not just the average similarity within a group, but also the average dissimilarity between groups. Analysts square root-transformed the data prior to applying ANOSIM or SIMPER. Clarke and Warwick recommend the use of Bray-Curtis similarity matrices as well.
The four diversity indices calculated include:
- Margalef’s Species Richness (d).
- Pielou’s Evenness Index (J).
- Shannon-Wiener (H’).
- Simpson’s (1-Lambda’).
Margalef’s and Pielou’s indices bias toward rare species, while the Simpson index is biased toward dominant species. Shannon-Wiener is generally the most balanced index of the four, but it is still sensitive to rare species.
Some analyses classified fish species according to their predominant habitat: pelagic or demersal. Specifically, Peterson Field Guides: Atlantic Coast Fishes, Fishes of the Gulf of Mexico, Volume 1, and Fishbase provided the bases for habitat classification.
If a habitat use description was not given for an individual species, the description given at the next higher taxonomic level, usually family, classified the species. The following guidelines governed assigning each fish species to one of the two categories:
- Demersal (Benthic)-bottom-dwelling; occurring on the seafloor, whether shallow or deep water.
- Pelagic-living in open waters away from the bottom or a demersal species that commonly preys upon benthic organisms.
For example, filefishes (Aluterus sp.), are not considered demersal, but they feed on benthic organisms such as soft-bodied invertebrates and sponges.
Recognizing the presence of pelagic species is important as many tend to be schooling fishes, which can skew statistical analyses.
Gulfstream also performed a separate analysis of commercially important species. The Gulf of Mexico Fishery Management Council’s Commercial Fishing Regulations for Gulf of Mexico Federal Waters (December 2004) species list, and the red drum fishery and reef fish fishery sections of NOAA’s draft for the Generic Essential Fish Habitat Amendment to the following management plans of the Gulf of Mexico (GOM), determined which species were of commercial interest.
Results
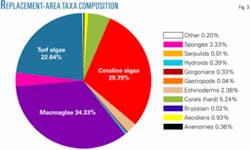
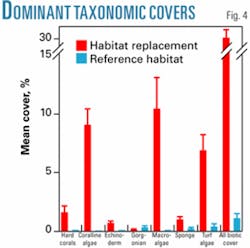
The transect information showed that a diversity of fauna was found within the habitat replacement areas (Fig. 3) and that biotic cover was 10 times greater in habitat replacement stations than at reference habitat stations (Table 1). Percent biotic cover was also significantly greater in the habitat replacement areas than in the reference habitat for all of the dominant taxonomic categories except gorgonians (Fig. 4).
null
Photostation information also showed that mean biotic cover in habitat replacement areas (93.9, 1.0%) was more than 25 times greater than in the reference habitat (3.3, 1.8%). The difference in cover was significant for habitat replacement areas as compared to reference habitat photostations but not between habitat replacement types (one-way ANOVA, F = 440.3, P = *0.001, SNK multiple comparison results) which were almost identical for the limestone boulder (mean = 94.6, 1.4%) and reef module (93.6, 1.4%) stations.
The transect information showed the dominance of turf algae, macroalgae, and coralline algae at the habitat replacement stations (Fig. 4). This coincided with the photostation information showing that cover was dominated by turf algae along with Cladocora arbuscula (coral) and Halisarca sp. (sponge). Taxonomic diversity in the habitat replacement sites varied significantly from that of the reference habitat (Table 2). The community structure in the habitat replacement sites also varied significantly from the natural hard-live bottom reference habitat using PRIMER. SIMPER analysis showed a greater number of algal species (including coralline algae) contributing to the difference in community composition (Table 3).
Editor’s note: A full bibliography was included in Part 1 of this article (OGJ, Jan. 1, 2007, p. 58).
