US energy demand will increase this year as the economy grows at a tempered pace. Winter weather will be milder than normal, requiring less heating, but temperatures in the summer are also expected to be higher than usual, requiring more cooling.
Demand for electric power generation will drive much of the energy needed in the US in 2007. OGJ forecasts increases in consumption across all forms of energy. Oil, natural gas, coal, nuclear, and renewable energy each will gain small demand increments from a year ago.
Transportation fuel consumption will push US oil demand in 2007. This will be the result of slightly lower prices, economic growth, and growing volumes of ethanol entering the gasoline market.
US production of crude and condensate will move up nearly 2% this year after declining in 2006. Oil production will increase worldwide.
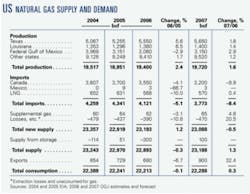
US natural gas supply will be up just 1% from 2006. Gas demand will be up by less than that, though, despite the need for more electricity generated from gas. Inventories will decline a bit on stronger demand in the summer.
Economy, energy
OGJ forecasts that the US economy will grow in 2007 but that the pace will be down from last year.
Many factors are weighing on the economy, including the cooled housing market. But energy prices will be lower this year. Additionally, personal income has been rising steadily for the past few years, according to the US Bureau of Economic Analysis.
With the Federal Reserve watching inflation and interest rates, real gross domestic product (GDP) will climb 2.2% this year after last year’s 3.2% gain.
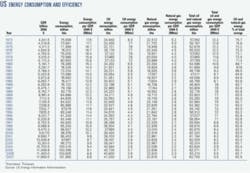
US energy demand this year will grow 1.1%. Consumption of all forms of energy, including oil, gas, coal, nuclear, and renewable energy, will total 101.95 quadrillion btu (quads).
Energy efficiency will barely improve this year. Energy use will decline to 8,750 btu/$ of GDP from 8,840 btu/$ a year ago.
In 2006, total US energy demand increased an estimated 0.4%. Consumption of oil and gas declined a bit, while coal demand was unchanged, and consumption of nuclear and renewable energy grew.
Energy sources
While this year’s growth rates for all types of energy will be modest, the largest percentage of growth will be for renewable energies. Included in this group are wind and solar energy and hydroelectric power generation.
OGJ expects energy from renewable sources to climb 5% this year. This group will still account for the smallest share of total US energy used: 6.7%.
Total US energy consumption for renewable energy will be 6.85 quads this year. In 2006, demand for renewable energy sources increased 8%, mostly as a result of an increase in hydroelectric power generation. Hydro is the largest component of the group of renewable energy sources.
But oil will remain the largest of all energy sources in the US this year. Representing 40.2% of US energy demand, oil consumption in 2007 will total 41 quads. This is up 1.1% from last year, when oil demand contracted 0.3% on strong crude and product prices.
Natural gas consumption will be 22.67 quads, inching up from last year. In 2006, demand for gas in the US recorded a negligible decline.
Total US coal demand will be 23.1 quads this year, up 1.4%. Coal demand was stagnant last year, as total electric power plant demand for all forms of energy was little changed from 2005.
Nuclear energy demand in the US will almost be unchanged from 2006 and will account for 8.1% of the energy mix. OGJ forecasts that nuclear demand this year will total 8.3 quads.
Oil supply
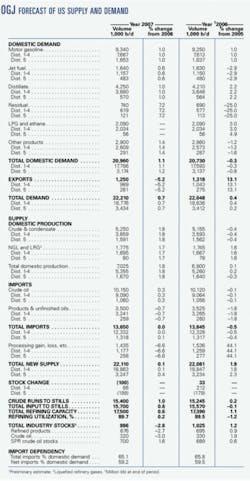
US oil production will increase to average 5.25 million b/d this year. Meanwhile, production of natural gas liquids and liquid refinery gases will move up 1.7% to average 1.775 million b/d.
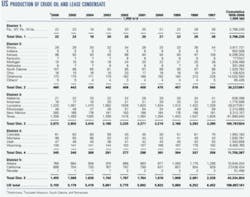
US crude and condensate production last year averaged 5.155 million b/d, down from the 2005 average of 5.178 million b/d. NGL production last year grew 1.6%.
In 2006, declines in oil production in Alaska, Texas, and California overcame increases in crude and condensate production in Louisiana, New Mexico, and North Dakota.
Alaska’s oil production decline last year was one of the largest in recent years, an estimated 11%. Average production in 2006 was 768,000 b/d. Production from the North Slope peaked in 1988, when Alaska’s crude and condensate production averaged 2 million b/d.
Louisiana’s oil production recovered somewhat last year following the hit it took from Hurricane Katrina. In 2005, Louisiana’s output fell to an average 1.06 million b/d from 1.47 million b/d a year earlier. Last year, OGJ estimates that Louisiana’s crude and condensate production averaged 1.22 million b/d.
Inventories
Volumes of crude and oil products in storage will finish 2007 lower than a year earlier. OGJ forecasts that at yearend the amount of crude in the Strategic Petroleum Reserve also will climb, reaching 700 million bbl.
Total industry stocks of crude and products will decline almost 3% this year. Crude in industry stocks will be 320 million bbl, and products will total 676 million bbl.
Inventories of crude and products ended 2006 near their end-2005 levels, with total stocks staying above normal throughout the year. Crude stocks increased to 330 million bbl last year from 324 million bbl, and product stocks were up about 1% to 695 million bbl.
Refining
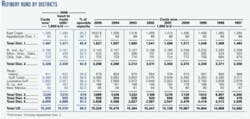
Processing at refineries will remain strong in 2007, with throughputs, operable capacity, and utilization up a bit from last year.
OGJ expects US refining capacity to increase marginally to 17.5 million b/d this year. Total inputs will average 15.7 million b/d, resulting in 89.7% utilization.
For 2006, the utilization rate declined to 89.5% from 90.6% a year earlier. That drop was caused by refinery and pipeline outages in the first half of 2006 following Hurricanes Katrina and Rita in 2005.
Average refining margins generally were strong last year compared with 2005, although the average East Coast margin declined 11% from year to year, according to Muse, Stancil & Co. The West Coast refining margin remained the strongest, averaging $24.57/bbl and gaining 17% for the year.
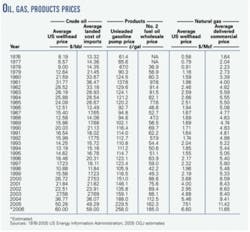
Average refiner acquisition prices for crude were up 22% last year. The average domestic and imported cost of crude for US refiners was $61.36/bbl, according to EIA. But pump prices last year climbed, too, up 12% on average for regular unleaded gasoline.
Oil imports
Total US imports of crude and products will be unchanged this year. Product imports will decline by a small margin, and crude imports will rise by an even smaller amount.
In 2006, total imports declined 0.5% from their all-time high of an average 13.714 million b/d a year earlier. When US refining activity was curtailed following the hurricanes, the US imported products to meet demand.
Product imports soared above 4.7 million b/d in October 2005, compared with imports of 3.1 million b/d a year earlier. By October 2006, product imports had returned to a more typical average of 3.05 million b/d, according to estimates by the US Energy Information Administration.
With this year’s total imports of crude and products averaging 13.65 million b/d, US import dependency will be 65.1%, a small decline from the past 2 years’ dependency levels.
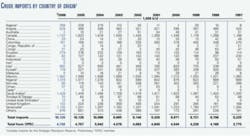
At press time EIA’s import data by country was available through September 2006. These figures show that for the first 9 months of last year, the leading source of US crude imports was Canada. Mexico, Saudi Arabia, Venezuela, and Nigeria were the next largest sources of US crude imports.
Canada also was the leading source of US product imports for the first 9 months of 2006. Other top suppliers of products to the US last year were the US Virgin Islands, Algeria, Venezuela, and Russia.
Oil demand
A weather-driven reduction in demand this month led to a drop in futures prices for crude. In the first two trading days of 2007, the front-month delivery price for oil on the New York Mercantile Exchange plunged more than $5/bbl.
In 2006, average oil prices were strong on the expectation of continued worldwide demand growth and limited spare production capacity. The average US landed cost of imported crude was an estimated $59/bbl last year, an annual increase of 20%.
In the US this year, demand for oil products will increase 1.1%, with consumption of each product type growing or being unchanged from 2006.
Total US demand for oil products will average 20.96 million b/d this year. US exports of products and crude oil will decline 5% to 1.25 million b/d, bringing total demand for oil in the US to 22.21 million b/d.
Last year demand for motor gasoline, distillate, liquefied petroleum gas, and ethane increased, but demand for jet fuel, residual fuel oil, and other products declined, resulting in a small overall decline for oil product demand.
Consumption of these products depends on economic growth, travel, weather, fuel-switching capabilities, petrochemical production, and transport. A factor gaining importance is the growth of ethanol in the US energy mix.
Distillate
Demand for distillate will increase 1% this year. With heating-oil demand unchanged from last year due to mild weather, all distillate demand growth will be the result of increased demand for diesel fuel.
This growth in diesel demand is spurred by the need to transport more ethanol to US gasoline outlets. The ethanol, used as an oxygenate and volume extender in gasoline, needs to move to markets from many plants, mostly located in the Midwest.
Because ethanol is not transportable with gasoline via pipeline, suppliers must use railroads cars or trucks, which now are required to use ultralow-sulfur diesel.
For the first 9 months of 2006, the average wholesale price for diesel was $2.058/gal. Diesel prices have climbed every year since 2002, when the No. 2 diesel fuel wholesale price averaged 72.4¢/gal.
Motor gasoline
Motor gasoline demand will grow 1% this year, too, the same pace at which it grew in 2006, as pump prices of gasoline have moderated from their summer 2006 highs.
OGJ estimates that the pump price for regular unleaded gasoline in the US averaged $2.58/gal last year. The average monthly price peaked at $2.999/gal for July, according to EIA. For November the average price had dipped to $2.241/gal.
Preliminary EIA data for 2005 indicate an improvement in passenger-car fuel-consumption mileage to 22.9 mpg. The rate for vans, pickup trucks, and sport utility vehicles remained at 16.2 mpg, its level of the prior 2 years, which was down from 17.5 mpg in 2002.
Jet fuel
OGJ forecasts that US demand for jet fuel in 2007 will average 1.64 million b/d, up from 1.63 million b/d last year. The small change is due to consolidation in the airline industry and greater efficiencies in passenger travel, as well as moderate economic growth. In 2005, jet fuel demand averaged 1.68 million b/d.
US airlines carried 561.9 million scheduled domestic and international passengers on their systems during the first 9 months of 2006, up just 0.3% from the same period in 2005, the US Department of Transportation’s Bureau of Transportation Statistics (BTS) reported.
BTS said US airlines carried 0.4% fewer domestic passengers and 5.6% more international passengers during the first 9 months of 2006 than during the same 2005 period.
US carriers operated 4.2% fewer domestic flights during the first 9 months of last year than during the same period in 2005, while international flights were up 2.8%, BTS reported.
Residual fuel oil
Demand for residual fuel oil will rebound this year following a large, price-driven decline in 2006. Natural gas had a price advantage to resid last year, so power producers took advantage of available fuel-switching capabilities.
OGJ forecasts that resid consumption will average 740,000 b/d this year, up from 690,000 b/d last year.
The average retail price of resid excluding tax was just 53.1¢/gal in 2001 but has climbed each year since then with the price of crude oil. In 2005, the retail price of resid averaged $1.048/gal, while demand was 920,000 b/d. Through the first 9 months of 2006, the price averaged $1.263/gal.
LPG, ethane, other
OGJ expects consumption of liquefied petroleum gases to be unchanged this year from 2005, when demand averaged 2.09 million b/d.
Growth in demand for these products has been dampened by reduced petrochemical production in the US, as well as higher prices. Demand peaked in 2000, averaging 2.23 million b/d.
Demand for all other petroleum products, including ethanol and other gasoline blending components, will increase this year to average 2.9 million b/d.
Consumption of these products declined 1.2% last year, averaging 2.86 million b/d. The category also includes products used in construction and as feedstocks in plants that were damaged by Hurricanes Katrina and Rita in 2005.
Natural gas
OGJ forecasts that US production and consumption of natural gas will grow modestly in 2007.
Warmer-than-normal weather in the first quarter of 2007 will put a ceiling on demand, leaving plenty of gas in storage as production climbs.
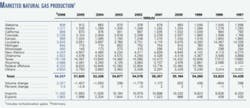
Offshore gas production from federal waters of the Gulf of Mexico will lead growth in US production this year. OGJ expects total US marketed production to be up 1.6% from 2006. New producing fields will slightly outpace decline rates.
Gulf of Mexico production will climb almost 3% this year. Gulf marketed production declined 2.9% last year as a result of lingering damage to production facilities and pipelines sustained during the 2005 hurricane season.
Production in Texas and Louisiana will increase, though less than during 2006. And gas output from all other states this year will record a collective increase of 1.2%.
Through the first half of 2006, production was down in Alabama, Alaska, Florida, Kansas, New Mexico, and the federal offshore area. But big increases in production were posted in Texas, Wyoming, Oklahoma, Montana, Mississippi, and others to offset those declines.
The volume of working gas in underground storage held above the previous 5-year range throughout 2006, limiting the amount of gas that the US needed to import.
US imports of gas this year will be off 8.4%, OGJ forecasts. The decline will be the result of a 10% drop in gas imported from Canada. Imports from Canada will total 3.2 tcf this year as an increasing amount of that country’s gas is needed for the production and processing of heavy oil and oil sands.
LNG imports will total 570 tcf this year, little changed from a year ago. US LNG imports plunged 10% in 2006.
US gas exports this year will increase to 900 bcf following last year’s decline to 680 bcf from 729 bcf in 2005.
OGJ forecasts that US consumption of gas this year will total 22.288 tcf, up 0.3% from last year.
While the amount of gas consumed in the US over the past few years has been fairly steady, there has been a shift in demand by type of consumer. Since 2003, the volume of gas consumed by electric power plants has increased. At the same time, gas demand by residential, commercial, and industrial consumers has declined.


