Since 1995, a totally unanticipated restructuring of the US refining industry has reconstituted the corporate identities of the largest refiners. By 2007, venerable names-Amoco, Arco, Ashland, Clark, Coastal, Diamond-Shamrock, Texaco, and Unocal-had disappeared from the roster. Has the industry reached such concentration levels that further mergers and acquisitions will be successfully challenged by government agencies? Is the M&A party over? This article concludes that it is not.
According to the 1995 OGJ refinery survey, 91 companies operated 169 refineries with 15.4 million b/d of refining capacity in the US (OGJ, Dec. 18, 1995, p. 41). By 2007, OGJ reported, the number of refining companies had dropped to 51 companies operating 131 refineries with a total capacity of 17.3 million b/cd (OGJ, Dec. 18, 2006, p. 56, and OGJ Online survey).
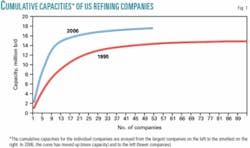
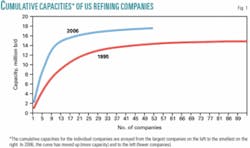
In the intervening years, refinery capacity had risen by 1.9 million b/d. Fig. 1 shows the change in the structure over those years. The cumulative capacities for the individual companies are arrayed from the largest companies on the left to the smallest on the right. During 1995-2006 the curve moved up (more capacity) and to the left (fewer companies).
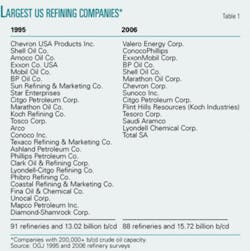
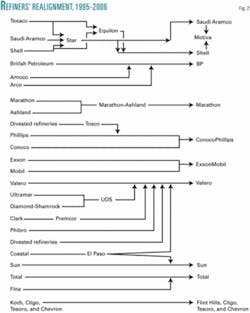
Remarkably, no new grassroots refineries were built during that period, but total US capacity increased by the equivalent of almost one world-class refinery (250,000 b/d) every year. Table 1, taken from OGJ refinery surveys, shows a recap of the largest refiners in 1995 and 2006 (those with more than 200,000 b/d of capacity.) In a rash of mergers and acquisitions, the top 25 refining companies in 1995 had been absorbed by the top 14 of 2006 in the manner shown in Fig. 2. In the process, there were survivors and casualties.
null
Survivors
Among the survivors were:
- Shell Oil Co., which absorbed Texaco’s refining business and, with Saudi Aramco, Texaco’s interest in the Star joint venture, which was renamed Motiva Enterprises.
- BP Oil Co., which took over Amoco and Arco.
- Sunoco (formerly Sun), which acquired part of Coastal Corp.
- Marathon Oil Corp., which absorbed Ashland Petroleum Co.
- Koch Industries Inc. and its subsidiary Flint Hills Resources.
- Saudi Aramco, joint venture owner of Motiva with Shell.
- Citgo Petroleum Corp., owned by Venezuelan national oil company Petroleos de Venezuela SA (PDVSA).
- Chevron Corp., which previously had absorbed Gulf Oil Corp. and later acquired Texaco Inc. and Unocal Corp. but received none of their refining assets.
- Also, in two “mergers of equals,” Exxon Corp. and Mobil Corp. merged to become ExxonMobil Corp., and Conoco Inc.-a spin-off from DuPont Chemical Co.-merged with Phillips Petroleum Co. (which previously had absorbed Tosco Corp.) and became ConocoPhillips.
- New entrants Valero Energy Corp. and Tesoro Corp., which didn’t even appear on the 1995 list, between them swept up another 19 refineries during the 12 years from 1995 to 2007.
Casualties
Among the casualties:
- Amoco Oil Co. was absorbed by BP.
- Star Enterprises, the Shell-Texaco-Saudi Aramco joint venture, was absorbed by Shell and Saudi Aramco.
- Tosco Corp. was swallowed by Phillips before the Conoco-Phillips merger.
- Arco was acquired by BP.
- Texaco’s refining assets were absorbed by Shell and Motiva.
- Ashland Petroleum Co. was taken over by Marathon.
- Clark Oil & Refining Corp., after a name change to Premcor Group Inc., was absorbed by Valero.
- Lyondell-Citgo Refining Co. was incorporated into Lyondell Chemical Corp.
- Phibro Refining Co. was acquired by Valero.
- Coastal Refining & Marketing Co. was absorbed in pieces by Sunoco and Valero.
- Fina Oil & Chemical Co. became part of Total SA.
- Mapco Petroleum Inc. was purchased by Delek US Holdings Inc.
- Diamond Shamrock Corp. merged with Ultramar Ltd. then was absorbed by Valero.
- Unocal Corp. was absorbed in part by PDVSA’s Citgo and then by Tosco Corp., which ultimately became part of Phillips and then ConocoPhillips.
Questions surface
The disappearance of so many corporate entities during such a busy period of expansion might provoke some questions in suspicious minds. Stoking that interest might be the rise in the level of profitability in the refining sector from the unacceptable levels of the mid-1990s to the much more attractive levels and investment opportunities evident in the last 2 years.1 Indeed, OGJ’s Construction Survey at yearend 2006 told of another 600,000 b/d of US capacity under construction or planned, including two new refineries.
The top 14 companies’ ownership of capacity, which increased to 86% in 2006 from 66% in 1995, might prompt the same wary minds to ask: “Is too much control in the hands of too few companies?”
Almost 100 years have passed since the US Supreme Court upheld a lower court’s decision to break up the Standard Oil Co. into 34 independent companies and undid its monopolistic control of crude oil and oil product prices. Standard had used refinery ownership as its primary tool. Yet by 2007, direct descendents of Standard Oil figure prominently as the industry survivors (Table 1).
ExxonMobil, for example, is comprised of the former Exxon-derived from Esso, which was originally Standard Oil of New Jersey-and Mobil Oil, formerly Socony Vacuum, which was originally Standard Oil Co. of New York. In addition, Chevron is comprised of companies that were formerly Standard Oil of California and Soky, Standard Oil of Kentucky. ConocoPhillips descended originally from Continental Oil Co., and Marathon Oil Co. originally was Ohio Oil Co., both Standard Oil companies.
Other Standard Oil companies disappeared into BP-Sohio (Standard Oil of Ohio) and Arco (Atlantic Refining Co., later Atlantic Richfield). More than a score of other refineries originally built by Standard Oil and its successors are now owned by Valero, Flint Hills, ConocoPhillips, and Tesoro.
US refining oligopoly?
Is it time to set the clock back and revisit 1911? Hardly.
By any contemporary measure, the US refining industry participants are poorly positioned to exert oligopolistic (much less monopolistic) control over the commercial aspects of crude oil or products. One of the favorite measures of concentration and control is the concentration ratio (CR). The CR is the sum of the percentages of the market shares of the largest four (sometimes five, denoted CR4 or CR5) companies. Economists consider a CR4 of over 50% a tight oligopoly and a CR4 of 25-50% a loose oligopoly.2 In the case of US refining, the CR4 is 46%.
The trouble with the concentration ratio is that it doesn’t put the top companies in context. Certainly if one of the top four refining companies held 40% and the other three held 2% each, that would have a different implication than if each held 11-12%. A better measure is the Herfindahl-Hirschman Index (HHI).
This criterion captures in a single number the relative size and distribution of the companies in a market. The formula is relatively simple: HHI is the sum of the squares of the market shares of each participant. For US refining companies in 2006, the HHI would be:
Adding the squares of the shares of the remaining 47 companies gives the sum of 768, the US refining industry’s HHI.
The US Department of Justice holds that: “Markets in which the HHI is between 1,000 and 1,800 are considered to be moderately concentrated, and those in which the HHI is greater than 1,800 points are considered to be concentrated.”3 In 2007, the US refining industry is well below those standards.
Some concerned economists might well point out that the US is not just one market but a composite of several. To examine that, the same data can be disaggregated. Most in the oil products industry will agree that the US refining markets fall into four logistical areas:
- The Gulf-Atlantic Coast, with 53 refineries. Granted, that is a broad geographic area. But the refineries on the Gulf Coast compete with East Coast refineries by shipping millions of barrels per day of oil products east and northeast through the Colonial and Plantation pipelines and by barge and tankers. In addition, imports of foreign oil products pour in on both coasts.
- The Midwest, with 19 refineries. This includes facilities from Memphis north to Minnesota and east to West Virginia.
- The Great Plains and Rocky Mountains, with 32 refineries. This sparse mid-America area is hardly a single market, but agglomerating these refineries makes more sense than aggregating by state where, for example, El Paso would be included with (but logistically unrelated to) Houston and the same would apply for Kansas City with St. Louis.
- The West Coast, including California, Washington, and Oregon, with 20 refineries.
This market demarcation seems to make more sense than the commonly used Petroleum Administration for Defense Districts (PADDs), an artifact of World War II that was originally concerned with defense.
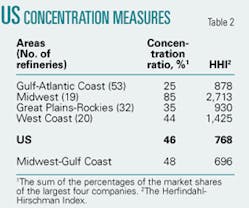
Placing each refinery in the Lower 48 states in one of these four areas gives the CR4s and HHIs shown in Table 2.
Three of the four market areas have HHIs and CR4s below the threshold of concern. The Midwest area, however, exceeds the guidelines by a wide margin-at least until additional logistical data is considered: The Energy Information Administration reports that over 1 million b/d of oil products enters this area from the Gulf Coast-nearly 25% of the total market supply.4 To reflect this actuality, a logistical system can be constructed by combining the Midwest with the Gulf Coast refineries. In that case, double counting with the Gulf/Atlantic Coast aside, the revised HHI for the “Midwest/Gulf Coast” is but 696, and the CR4 drops to 48%, both below worrisome levels.
What does this all mean? Despite the tumultuous concentration of 1995-2006, the refining industry in the US, or even in its logistical submarkets, is still less concentrated than what economists accept as important benchmarks. For that reason, mergers and acquisitions, such as Tesoro’s acquisition of Shell’s 100,000 b/cd Wilmington, Calif., refinery the first of this year, may continue for some time as companies seek to achieve economies of size and scope, and others choose to continue exiting the business.5
References
- “Petroleum Profiles of Major Energy Producers,” Energy Information Administration (EIA), December 2006.
- “Measures of Concentration” at Oligopoly Watch (http://www.oligopolywatch.com).
- US Department of Justice (http://www.usdoj.gov/atr/public/testimony/hhi.htn).
- “Petroleum Supply Annual 2006,” EIA.
- OGJ Online, Jan. 29, 2007.
The author
William Leffler (http://venusconsulting.tripod.com) is a consultant with Venus Consulting and teaches refining, petrochemical, and upstream courses. He worked at Royal Dutch Shell for 36 years in the upstream, downstream, and petrochemicals areas. He has authored five books in PennWell’s “Nontechnical Language” series, including his most popular, Petroleum Refining in Nontechnical Language. Leffler is a graduate of Massachusetts Institute of Technology and New York University.
