SPECIAL REPORT: World LNG netback series begins in this issue
Starting with this issue, Oil & Gas Journal will report LNG price netbacks for LNG supply from six gas liquefaction plants into six market destinations. The Purvin & Gertz LNG netbacks matrix will be presented to enable readers quickly to determine the netback value that could be realized from LNG sales.
Table 1 lists the supply sources and market destinations that will be reported in this weekly matrix.
LNG industry matures
Until the end of the last century, the global LNG industry could be described as rigid with movement of natural gas between gas liquefaction plants and LNG import-regasification terminals carried out via fixed trading routes under long-term inflexible contracts using dedicated LNG carriers.
For much of the industry’s history, LNG trade has been dominated by the supply of gas to the northeast Asian markets of Japan, South Korea, and Taiwan. Since the turn of the century, however, the global market has experienced a radical transformation with importers in the Atlantic Basin seeking a more prominent role in the business.
US and European markets have many similar characteristics but also differ quite significantly. Indigenous production in both the US and Europe, for all intents and purposes, has peaked and is now in decline with both regions looking increasingly to LNG to meet the supply-demand gap.
Furthermore, natural gas transmission and storage infrastructure in both regions are well developed, although it should be noted that infrastructure is less well developed in some southern Europe countries than in the north. In broad terms, however, the similarity ends there.
The US gas market is the most developed in the world with extensive gas import, transmission, and storage infrastructure, an industry structure that is unbundled with financial and legal transparency along the gas value chain and a multitude of players active in each segment of the industry.
In addition, gas prices are determined largely by gas-to-gas competition, with prices at the major trading locations generally bound by No. 2 heating oil on the high side and No. 6 residual fuel oil on the low side. To add depth and liquidity to the market, the US operates a futures market centered on the Henry Hub price in Louisiana.
The European market is less well advanced, although efforts by European Union (EU) regulators are slowly moving the market towards a model that will be structurally similar to that in the US. Currently, gas markets around Europe exhibit considerable variability in degree of liberalization and liquidity, with those in the north tending to be more like the US market than those in the south.
The gas industry that most closely resembles the US market is in the UK where infrastructure is well developed and prices reflect supply-demand fundamentals. Both markets have a similar supply-demand outlook. LNG will to play an increasing role in meeting future demand. Furthermore, a liquid forward market exists in the UK with gas priced at a virtual trading hub-so-called National Balancing Point, NBP-within the national gas transmission system.
Conversely, elsewhere in Europe, market liberalization is generally less well advanced than in the UK. Apart from indigenous production in the Netherlands and Norway, continental Europe relies almost entirely on imported gas, most of which is supplied under long-term contracts by pipeline from Algeria, the former Soviet republics of Central Asia, Norway, and Russia.
LNG import volumes into Europe are 20% of pipeline-gas-import volumes with France and Spain accounting for around three-quarters of the total. With security of supply becoming an increasing concern to the EU, however, LNG is viewed increasingly as a way of diversifying gas supply. The result is that, like the US, there are several LNG import terminal projects under various stages of development and planning.
Gas pricing in continental Europe is less well developed than in the US and the UK, although forward markets have evolved in the last few years, primarily in Northwest Europe.
The two most traded markets are the Zeebrugge market and the Dutch Title Transfer Facility (TTF), both of which operate as virtual trading hubs much like the UK’s NBP. Rules for the former, however, restrict trading activity to gas movements through the UK-Belgium Interconnector with the result that Zeebrugge prices tend to trade at a premium or discount to NBP prices depending on whether gas is flowing from or to the UK.
In contrast, TTF prices are highly correlated with average Belgian and Dutch gas pipeline import prices that are based on traditional long-term contract indexation parameters, primarily heating oil and residual fuel oil with a time lag. Thus, there will be occasions when NBP-Zeebrugge prices are linked to TTF prices, but during times of exceptional demand or supply disruption price dislocation occurs between the two markets.
While LNG and gas markets in the Atlantic Basin exhibit varying degrees of depth and liquidity, those in Northeast Asia tend to be more rigid, having evolved as a result of long-term gas contracts that were concluded in the 1970s and 1980s. Asian LNG prices have tended to be based on the formula used by Japanese buyers that indexes prices to the Japan Customs Cleared basket price for imported crude oil, otherwise known as the “Japan Crude Cocktail” (JCC).
The typical structure of this type of formula involves a fixed component and a variable component that relates to the JCC price. Variations of this formula exist to provide sellers with protection in a low-oil-price environment and the buyer protection in a high-oil-price environment, the so-called “S-curve.”
Although some long-term contracts concluded in recent years have departed from traditional pricing structure, much of the LNG that moves to buyers in northeast Asia is still priced against the typical formula.
Since the turn of the century, much of the Atlantic Basin gas industry’s attention has been focused on the US’s seemingly long-term insatiable appetite for LNG imports. Most, if not all, developers of gas liquefaction projects in the region and the Middle East have at some point targeted the US as an outlet for all or part of their output. The tightening in recent years of North American supply-demand balances has spurred the reopening and expansion of existing US LNG import terminals as well as development of significant new LNG import capacity.
LNG import growth has been strong in recent years, increasing to a peak of nearly 14 million tonnes in 2004 from 0.4 million tonnes in 1995. Forecasts of US long-term import requirement vary, with estimates ranging 40-60 million tonnes for 2010 rising to 80-120 million tonnes in 2020. Purvin & Gertz analysis1 suggests that the LNG import requirement will be at the top end of the ranges quoted with imports of 58 million tonnes forecast for 2010 and 118 million tonnes in 2020.
The US is not the only country or region, however, for which the LNG import outlook is strong. Europe imported 35 million tonnes of LNG in 2005; this import requirement is forecast to grow to 50-60 million tonnes in 2010 and 80-100 million tonnes in 2020. A similarly robust outlook exists for Asia-Pacific where imports are forecast to grow to 105-125 million tonnes in 2010 and 140-180 million tonnes in 2020 from 91 million tonnes in 2005.
The outlook for the global LNG market is therefore strong with total demand forecast to grow to 200-245 million tonnes in 2010 and 300-400 million tonnes in 2020 from 140 million tonnes in 2005; the US will become the largest single market for LNG sometime after 2010.
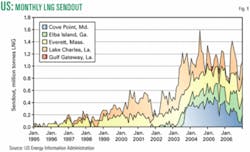
While the outlook for LNG imports into the US exhibits considerable growth, actual imports during the last couple of years have failed to match expectations. Imports peaked in 2004 at slightly less than 14 million tonnes but declined in 2005 to 13.3 million tonnes and shrank again in 2006 to 12.3 million tonnes. Current LNG import terminal receiving and gas send-out capacity is nearly 40 million tonnes/year (tpy; equating to a capacity of 3.3 million tonnes/month). It can be seen that capacity utilization has been low, in the range 30-40%, since 2003 (Fig. 1).
Failed expectations
One of the primary reasons reality has failed to meet expectations is that LNG cargoes that might otherwise have been delivered to the US have been diverted to other markets where higher price netbacks have been on offer to LNG producers.
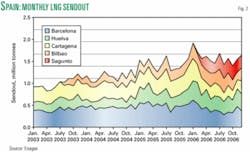
Much of this volume has been sold into Spain where a combination of strong domestic demand growth and low rainfall (more than 10% of Spain’s electricity generation being from hydroelectric plants) has contributed to an increasing requirement for imported gas. Consequently buyers have been willing to offer higher prices to attract cargoes away from the US with the result that the country’s LNG imports have grown rapidly in recent years (Fig. 2).
Despite LNG imports into Spain increasing in recent years, like the US Spanish LNG import capacity is underutilized. With a current LNG import capacity of around 31 million tpy (2.6 million tonnes/month), actual imports of 19 million tonnes in 2006 represent an average capacity utilization of around 60%
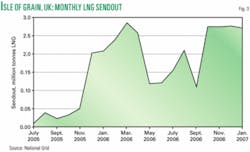
Contrary to the situation in these two countries, LNG import capacity utilization in the UK has been far higher. The Isle of Grain LNG import terminal commenced operations in July 2005 with a capacity of 3.3 million tpy (0.27 million tonnes/month). After a slow start, 2.5 million tonnes of LNG was imported in the first full year of operation representing 75% utilization. In fact, during winter months capacity utilization has approached 100% (Fig. 3).
The global LNG market is currently experiencing a significant transformation.
From the rigid structure that existed to the end of the last decade, the market has evolved to one in which considerable more flexibility prevails. Gas liquefaction projects are now being developed before all the output has been sold, and players are investing along the value chain to give them the opportunity to exploit price-arbitrage opportunities.
Even in Asia where the long-term contract has prevailed, contract renewals have been for shorter periods with buyers seeking to purchase LNG on a FOB (free on board) basis, thereby enabling them to move surplus volumes into alternative markets if domestic demand fails to develop as planned. Thus a more liquid spot market has been evolving with the volume of LNG sold under spot or short-term trades increasing.
LNG sellers are now faced with many market outlets for surplus volumes. Naturally the gas price in each market will reflect prevailing market conditions and, consequently, depending on the cost of LNG transportation, the netback price that can be realized will be vary by market destination.
Netback values
The netback values in the Purvin & Gertz matrix are calculated by determining the prevailing gas price in each market destination and deducting pipeline, regasification, and waterborne transportation costs, as appropriate, to arrive at an FOB netback price.
The costs of pipeline transportation, LNG regasification, and waterborne transportation are based on either reported costs or from Purvin & Gertz models and will include all key cost factors such as boil-off rate, demand seasonality in the market, and terminal sendout capacity.
The price of gas in each market destination is determined with the following methodology:
- Belgium: Purvin & Gertz’s estimate of imported pipeline gas prices at Zeebrugge.
- Japan: Calculated forward LNG import prices based on a typical LNG contract indexed to JCC.
- Spain: Calculated LNG contract prices based on a typical import contract using relevant indices.
- UK: Forward NBP prices.
- US Gulf Coast: Henry Hub forward prices.
- US East Coast: Purvin & Gertz’s estimate of Boston city-gate price based on Henry Hub forward prices.
The netback prices to be reported on a weekly basis will reflect “expected” prices in the market and, therefore, will represent the FOB price that an LNG seller or trader would actually realize in the market. This will be achieved with futures prices or Purvin & Gertz’s estimate of gas-LNG contract prices in the future based on typical price indexation terms.
In all cases the forward price used takes into account cargo loading and unloading time, voyage time, time to vaporize and sendout regasified LNG cargo at the import terminal, and a period between conclusion of a deal and the cargo being loaded. As an example, if it is mid month (m) and a deal is concluded that would result in the cargo being loaded, delivered, and regasified in the following month (m+1), then the m+1 futures price or Purvin & Gertz’s estimate of the m+1 contract price would be used as a price basis.
In comparison, if the seller is looking to sell the cargo into a more remote market that would result in half the cargo being regasified in the following month (m+1) and the remainder in the ensuing month (m+2), then the netback would be based on the average of the m+1 and m+2 prices. Thus, the published netback prices that can be realized by sales from each supply point will reflect the proximity of that supply point to the market of interest
The seasonal factors used to determine gas sendout rates have been based on published historical LNG import terminal utilization data or, when not available, on Purvin & Gertz’s assessment of the likely sendout rate based on the seasonal characteristics of the market concerned.
These seasonal factors are also used in calculation of LNG regasification tariffs, where appropriate, as it is assumed that sendout capacity is reserved to accommodate the maximum annual sendout rate with the result that a cargo may take longer to move into the market in the summer than in the peak demand months of the winter.
The amount of sendout capacity reserved is deemed to be in proportion to the amount of storage required to accept a full cargo as a percentage of total LNG storage capacity at the receiving terminal. In the calculation of LNG regasification tariffs, any LNG/gas used as fuel is priced at the appropriate market price for gas.
Waterborne freight rates are based on a standard 145,000 cu m LNG carrier with the cost of bunker fuel and boil-off LNG used as fuel reflecting prevailing oil prices and the appropriate price of LNG in the value chain, respectively.
Waterborne freight costs are based on the following assumptions:
- Time charter rate of $80,000/day.
- Laden boil-off rate of 0.145% and a ballast boil-off rate of 0.1%.
- Cargo loaded is 98.5% of vessel cargo capacity.
- Return heel is 5% of the loaded cargo.
- LNG carrier speed is 19 knots with 2 days each for cargo loading and discharge.
- LNG carrier operates for 340 days/year.
- LNG carrier owner has an 11% weighted average cost of capital (WACC) with capital expenditure financed on a 70/30 debt/equity basis.
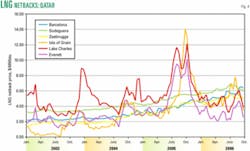
Analysis of historical LNG netbacks illustrates considerable variation between market destinations. As Fig. 4 shows, netbacks from the liquid markets in the US and UK exhibit considerable volatility when compared to the prices that can be achieved from sales into those markets that are represented in this analysis by contract prices incorporating time-lag based oil price indexation, i.e., Belgium, Japan, and Spain.
Similarly, the netback price exhibits significant variation depending on the source of supply. Naturally, netbacks from more remote markets are affected by the higher cost of transportation (Fig. 5). Analysis of these results on an ongoing basis will go some way to explaining future LNG trade movements.
Reference
- “North America Natural Gas Market Outlook,” Purvin & Gertz Inc.
The author
Chris Holmes ([email protected]) is a senior principal with international energy consultants Purvin & Gertz Inc. in its London office. He holds a BSc (honors) in chemical engineering from the University of Birmingham and has worked for with Amoco (UK) Ltd., as a process engineer at its Milford Haven refinery and as a refined products trader in London and for international energy advisers Gaffney, Cline & Associates as a senior consultant.


