Mideast site tests fiber-optic corrosion monitoring system

Field trials in a Middle East gas processing plant have assessed a new approach to monitoring wall thickness loss caused by corrosion or erosion processes. The fiber-optic-based monitoring system was developed by Fiber-Optic Systems Technology Inc. (FOX-TEK), Toronto, and jointly field tested by the Saudi Arabian Oil Co.
The work, conducted during a joint industry program between FOX-TEK and Saudi Aramco, was designed to investigate the use of fiber-optic sensors (FOS) as a corrosion-monitoring system for hard-to-reach areas or remote locations in oil and gas installations such as gas-oil separation plants, pipelines, gas plants and refineries.
The primary objective of this program was development of a sensor system and software tool capable of monitoring WT losses, temperature, pressure, ground movement, stress corrosion crack propagation, and leak detection through laboratory testing and field trials.
The system was installed on a 12-in. x 20-in. reducer, connecting a gas feed line into a large pressurized vessel. This reducer represents one of the most difficult and complex shapes to monitor and analyze because the diameter change from top to bottom produces nonuniform stresses and there is a nonuniform thickness along and across the wall.
Ultrasonic testing (UT) technology was used to determine a baseline for the initial WT and subsequently to validate periodically the fiber-optic sensor measurements. Although the monitoring took place over the relatively short period of 6 months, a trend of WT losses was demonstrated with both technologies.
It is important to point out that the WT loss measured during the monitoring period is within the accepted error range of the UT technology. Therefore, the precision of the FOS can be verified when the thickness loss exceeds the UT error range or during destructive testing of the reducer.
The average value of remaining WT obtained by FOS measurements is a slightly lower thickness than the values obtained by UT. Nonetheless, the trend of the thickness loss is consistent for each sensor location when compared to initial and final UT readings. Therefore, these results clearly show that the FOS technology can measure WT loss and it should be used for this purpose on critical areas that require continuous or periodic monitoring.
Conventional technique
Most onshore and offshore oil and gas facilities, including upstream and downstream plants such as gas-oil separation plants, pipelines, and refineries rely on conventional corrosion-monitoring techniques or periodic inspection as a means of corrosion management.
In general, accuracy, frequency of data collection, and cost are significant factors for the overall corrosion monitoring or corrosion-management program. With regards to conventional corrosion-monitoring techniques, users normally rely on corrosion coupons made from materials similar to the pipes that are intended to be monitored or use intrusive corrosion-monitoring probes based on electrochemistry measurements.
Both corrosion coupons and electrochemistry-based corrosion monitoring techniques, however, depend upon the principle of corrosivity measurements of the carried media. These types of measurements may not reflect the real changes occurring to the actual pipe or vessel. In many cases, data obtained by such indirect measurement techniques are not fully reliable and may provide misleading information to operators. In the operation of a large network of oil and gas facilities, this practice creates an undesirable risk.
FOS trial
The Saudi Aramco Master Gas System, completed in the early 1980s, harnesses for domestic and world markets immense quantities of associated natural gas in Saudi Arabia’s oil fields. Designed to process up to 9.9 million cu m/day (3.5 bcfd) of gas, the system furnishes fuel and feedstock for plants at the Saudi industrial cities of Yanbu’ and Jubail: mainly oil refineries, petrochemical and fertilizer plants, plus a steel plant, and a rolling mill.
Collection of the gas begins in the kingdom’s eastern oil fields, where it is separated from crude oil in one of 34 gas-oil separation plants (GOSPs) and piped to strategically located gas plants. At those plants, the gas is treated to remove sulfur compounds and carbon dioxide.
The main reason for installing the FOS system on a reducer in one of the system’s gas processing plants in the Eastern Province was to identify issues related to plant operation that may not be typically encountered in laboratory testing. The 20-in. x 12-in. reducer (Fig. 1) in the de-ethanizer section of a light crude stabilization plant was selected because of a history of high corrosion rates of up to 3 mm/year (118 mpy) caused by the sour gas (C1 = 15%; C2 = 35%; C3+ = 33%; CO2 = 7%; H2S = 10%) environment, a nominal operating pressure of 2.76 MPa (400 psig), and a typical throughput of 1.5 million cu m/day (53 MMscfd).
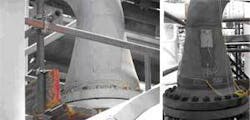
Because the FOS system is nonintrusive and can be installed at relatively high temperatures, no shutdown is required to install the sensors. Eight sensors were installed on the reducer, which is located in the inlet line of an economizer. The FOS system is designed to monitor WT losses as well as pressure and temperature changes.
Measuring pressure and temperature changes is essential because the analysis engine in the FOS system database software separates all strains caused by changes in process parameters from the strain caused by wall thinning. The WT losses of the reducer were benchmarked by monthly readings that used UT scans.
Installation
At the time of installation, because the minimum period of monitoring the wall thinning of the reducer to observe a significant loss was unknown, it was decided to set the monitoring period at 90 days. Data collected during that initial period, however, showed wall-loss values that could not be verified due to the limited sensitivity of the UT technology. The monitoring interval was subsequently extended to 6 months.
FOX-TEK, to conduct proper installation, performed a complete site survey and preparation. The survey included the following:
- Collect data relevant to the parameter of interest, including the history of ultrasonic measurements, temperature, pressure, material grade, and pipe dimensions.
- Ensure the presence of needed infrastructure before installation of the FOS system, including instrument room, conduit-protected optical trunk, breakout boxes, area accessibility, and surface preparation.
This preparation involved removing any insulation or protective covers from the site of interest before installation and sand blasting the locations of the intended sensors placement.
The system requires placement of the FT 3405 sensor monitor inside an instrument room where AC power and a computer network are available. For an optimal set up, the FT 3405 monitor is directly connected to the network via an ethernet port so that data downloading and analysis can be carried out from any computer on the network.
The fiber-optic sensors mounted on the pipe to be monitored are connected to fiber-optic leads that run inside conduit. The conduit starts about 30 cm from the sensors and runs to the first breakout box, preferably within 10-20 m of the sensor area.
The second conduit runs from the first breakout box to the second breakout box, which is close to the FT 3405 scanner inside the instrument room. The second conduit has no minimum length and can be run several hundred meters from the first breakout box.
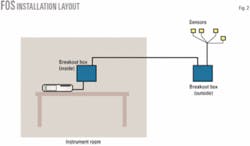
Fig. 2 shows a simplified schematic drawing of a typical fiber-optic system installation layout.
The first four coil sensors, configured to monitor WT, were mounted on the surface of the reducer at its mid-point at clock positions of 3, 6, 9, and 12. Two FOS temperature sensors were installed immediately above the 3 and 9 o’clock sensors to measure the local pipe thermal strain for compensation of the WT sensor readings (Table 1).
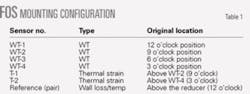
In addition to the four WT and two temperature sensors, another coil sensor was mounted on the 12-in. pipe just above the reducer to provide pressure change readings and to act as a reference sensor for WT readings. The location was selected on the basis that the 12-in. pipe has minimal wall loss.
If corrosion takes place at the reference sensor location, however, the analysis based upon the reference reading will not give the desired precision because the compensation for pressure changes will not be accurate. Therefore, to achieve high precision WT readings with FOS, reference sensor must be installed on a pipe section that is expected not to experience corrosion or the actual corrosion rate should be taken in consideration during model development and data analysis.
The fiber-optic sensor leads were guided through conduit to the first explosionproof breakout box. The sensor leads were fusion spliced to the ends of a 12-conductor fiber-optic trunk cable that had been installed earlier in a conduit run from an instrumentation room several hundred meters away.
An FT 3405 Sensor Scanner was installed in the instrumentation room and the trunk cable was connected to the front panel connectors with fusion-spliced E2000 connectors. The FT 3405 was programmed to scan each of the eight channels 10 times, once hourly, and store the data in a nonvolatile memory aboard the scanner.
The data were periodically downloaded (weekly for the purpose of this trial) to a laptop computer. The collected data were then entered in the FOX-TEK DMAT (database management and analysis tool) database software for analysis to obtain wall loss and changes in temperature and pressure.
An analytical model was developed that embodied the relationship between the surface strains at various locations on the reducer. Information from the model was entered into the database software, where changes in the sensor strains are converted into WT values. The software includes calculations that directly compensate the sensor strains for changes in pressure and temperature using values obtained from the reference sensors. The database also archived all of the raw data to facilitate tracking of historical trends and to preserve the information for further data imports.
Data compilation
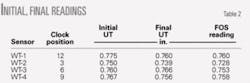
A UT scan was carried out during installation of the FOS on the reducer. Table 2 shows initial readings from the UT scan. To achieve accurate results with similar components, selecting a suitable UT instrument is crucial.
The instrument should be designed by the manufacturer for the thickness gauge measurement of corroded pipes and vessels, with a good capability for eliminating interference or distortion produced by corrosion products or corroded surfaces in general.
The FOS measures displacement produced by changes of process parameters and WT of the component upon which the sensor is mounted. The scanner stores the displacement readings of each sensor.
Over the 6-month monitoring interval, the gathered FOS data were processed weekly with the database model specifically developed for this reducer. The database built within the DMAT software is another critical part of the technology. It uses the sensor strain data collected by the scanner and converts them into meaningful measurements of WT values, which become meaningful only after compensation for the pressure and temperature changes of the process after adjustment with reference sensors.
A comparison of initial and final UT readings to the FOS measurements, as determined by the DMAT software after 5 months of continuous monitoring, appears in Table 2 and Fig. 3. These results show that the fiber-optic sensors indicate a wall loss at each location.
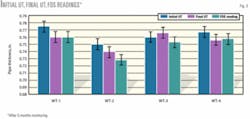
A comparison of the FOS and final UT readings shows agreement of the wall reduction at three out of four locations. The UT measurement at sensor location WT-3 shows a WT increase; however, the change is within the acceptable accuracy for field measurements. It is important to note the overlap of the 1% error bars, which indicates the small values of WT losses during the 5-month period of monitoring.
It is believed that longer monitoring will produce more obvious data, especially when the difference in the thickness becomes higher than the UT instrument error. The precision of the FOS measurements will be clear following a longer period of monitoring.
In an attempt to generalize the wall loss across the circumference of the reducer, Figs. 4a and 4b are plotted to show the average wall losses measured by FOS and UT. The two different y-axes scales demonstrate the small amount of wall losses during the 6 months of monitoring.
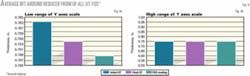
It is important to note that averaging the values of different sensors is not the purpose of this technology because it is designed to monitor critical areas. Therefore, in real implementation, this average will not be used because it may give misleading values to actual wall losses.
System benefits
The FOS system is a new approach to monitoring WT loss. The FOS system has several benefits over existing monitoring techniques as follows:
- Nonintrusive.
- Sensors have long operational life and are permanently bonded.
- System continuously monitors process parameters and WT.
- No interruption to the process was reported or needed during sensor installation or system operation.
- Once installed, the system requires no operator attendance for routine monitoring.
- Sensors have no moving parts and no cleaning is required.
- Sensor is made of glass fiber (no metals) and carries no electrical current. The sensor carries only light; therefore it is safe for plant equipment and personnel.
- There is no interference with other wireless or plant instruments.
Results obtained out of this work show that the fiber-optic system can monitor high rates of WT losses. The precision of the measurement will be determined in future work. Following is a list of the main findings of this work:
- The research program produced the desired results in developing the nonintrusive fiber-optic sensor system for monitoring pressurized pipes and vessels in terms of a high rate of wall thinning and changes in temperature and pressure.
- The FOS technology proved to be, through laboratory and field testing, a good monitoring technique for WT losses of components of the pressurized system. Therefore, this technology is a suitable choice whenever UT scans and other inspection or monitoring techniques become impractical in terms of frequency of inspection required, cost, and reliability of other techniques.
- The FOS system is not standalone equipment that can be purchased and used without developing some expertise at undertaking site surveys for installation, development of a database for each site, and data analysis. Therefore, it requires a certain level of initial involvement with the manufacturer and technical support in most cases.
- This FOS technology is recommended to be further explored in terms of field and laboratory trials for other applications such as leak detection, and refinery overhead line corrosion monitoring.
The authors
Ihsan Al-Taie ([email protected]) is senior corrosion corrosion for Saudi Arabian Oil Co. Previously, he has been a research scientist for Energy Mines & Resources Canada and a group leader-materials degradation, materials technology laboratory, Natural Resources Canada. Al-Taie holds a BSc in chemistry from the University of Mosul, Mosul, Iraq; and a PhD from the corrosion and protection center, University of Manchester Institute of Science and Technology, UK. He is a member of NACE International and the Saudi Arabian International Chemical Sciences (SAICS) chapter of the American Chemical Society (ACS).
Faiz Al-Musalami ([email protected]) is a corrosion engineer for the Saudi Arabian Oil Co. He holds a BEng in chemical engineering from King Fahd University of Petroleum and Minerals, Saudi Arabia and a master’s in metallurgy from the University of Alabama. He is a member of NACE International.
Bander F. Al-Daajani ([email protected]) is a corrosion scientist for Saudi Arabian Oil Co. He holds a BEng in chemical engineering from King Saud University, Saudi Arabia.
Abdulla Al-Bakhat ([email protected]) is a supervisor of engineering inspection and corrosion for Saudi Arabian Oil Co. He holds a BEng in computer engineering from King Fahd University of Petroleum and Minerals, Saudi Arabia, and is a member of the Saudi Engineering Society and NACE International.
Don Morison ([email protected]) is vice-president for design and development at Fiber-Optic Systems Technology Inc. and one of the developers of FOX-TEK’s sensor technology. He is responsible for all engineering, research and development, and project planning. Morison, a member of Professional Engineers Ontario for more than 20 years, holds a PhD in aerospace engineering from the University of Toronto and worked as a consultant on numerous advanced materials and sensing projects prior joining the company during its start-up.
Thierry Cherpillod ([email protected]) is manager of engineering and senior field project manager for FOX-TEK and a founding member of the company after working 12 years at the Institute for Aerospace Studies, University of Toronto, working in the space dynamics, controls, and robotics group. Cherpillod holds a bachelor’s degree in electrical engineering from Ryerson Polytechnic, Toronto.