Interferometry extracts valuable phase information from seismic
For well over 70 years explorers have used seismic survey techniques and seismic wave amplitude interpretation to discover oil and gas.
In that time they have relied solely on the measurement of seismic wave amplitude and have ignored the key parameter of seismic wave phase. In fact, they have chosen to remove seismic phase information from interpretation, opting to create and use zero-phase data.
Now seismic interferometry, a technology that creates and uses phase information about reflected and refracted seismic waves, has the potential to revolutionize exploration geophysics by creating a new dimension of analyzing the key parameter of phase. Use of phase data has led to the field testing and patenting of a technology to be called phase vs. offset (PVO©). Results so far indicate the use of phase information through seismic interferometry technology provides the information needed to find new and deeper deposits of oil and gas.
It has been demonstrated commercially that the parameter of phase is more important than amplitude in unlocking the intelligence behind any wave signal. In fact, interferometry in the light wave spectrum has been used to create great value in a wide array of industrial and scientific applications. These applications include measuring precise structural forms and distances and analyzing materials.
The author has adapted, developed, and patented the application of interferometry technology for use in seismic wave analysis and interpretation. Field tests were conducted in collaboration with a major oil company licensee using patented seismic techniques. Comparison of the data produced by interferometry-based analysis to zero-phase seismic data interpretation has demonstrated the effectiveness and potential of seismic interferometry.
The tests results showed that seismic interferometry and the resultant phase information provide direct detection of faults and compositional changes in the subsurface. Many of these interpreted discontinuities and lithologies were previously undetected with conventional seismic data interpretation.
It is patented and suggested that direct detection of hydrocarbons is also possible. It is strongly believed that the use of seismic interferometry will unlock deeper deposits of hydrocarbons that until now have been, for the most part, undetectable using amplitude information only.
Interferometric history
Interferometry is based on splitting a beam or wave of incoming light or sound.
Robert Hooke (1635-1703) first observed interference patterns using optical equipment. Sir Isaac Newton (1642-1727) studied and made famous these patterns, which were subsequently called “Newton’s Rings.”
Thomas Young (1773-1829), in what is described as the “world’s greatest experiment,” purposely split a light beam and created an interference pattern. This experiment demonstrated that light has wavelike characteristics, which led Young to the historic conclusion that light travels as a wave.
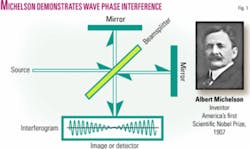
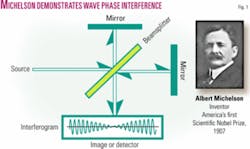
Some 100 years later, Albert Michelson (1852-1931) was honored as the US’s first Scientific Nobel Prize Laureate for inventing a remarkable optical instrument called the Michelson Interferometer.
Michelson successfully split a light beam into two beams through the use of a partially silvered mirror (Fig. 1). He then recombined the separate beams into an interference pattern. Since his discovery, optical interferometers have been used in thousands of applications to measure properties of surfaces and materials.
The study and use of interferometry has been an important tool for the scientific and engineering communities for over a century, mostly in the optical light spectrum. Current and past applications of optical interferometry include accurate measurement of length and distance, both surveying and astronomical, optical testing, measurement of displacement and vibration, studies of gas and fluid flow, studies of temperature flow and distribution, measurement of electrical and magnetic fields, interference microscopy, studies of refractive indexes and fields, and holographic interferometry. Many more exist.
Interestingly, around the same time Reginald Fessenden (1866-1932) invented the use of acoustic and seismic wave phenomena for surveying the earth. However, until now application of interferometry to seismic surveying and seismic interpretation has been undiscovered.
Interferometry basics
Three principle values describe any wave: amplitude, frequency, and phase.
In fact, the basic equation for a sinusoid of frequency (ω) or period (2π/ω) is:
f(t) = A cos(ωt + ϕ) Equation 1
where t is time, A is amplitude (defined above), and ϕ is phase.
Interferometry is defined as “the action or art of measuring wave interference phenomena.” Specifically, interference measurements yield information about the Principle Value-Phase (PV-Phase). Interestingly, it has been shown that much of the intelligence or information in a wave signal lies in the phase value of the signal. Simply speaking, the technology of seismic interferometry detects and measures seismic wave phase information.
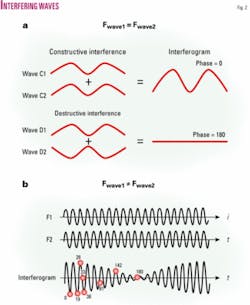
Since interferometry is the act or art of studying wave interference phenomena, one way to characterize phase phenomena is to look at a graph of two signals of the same frequency compared at two widely varying phase angles (Fig. 2a).
Two waves of the same frequency are graphed, one as constructive waves and the other as destructive waves. That is, the phase angle of the first two waves is zero degrees and the phase angle of the second two waves is 180°.
Shown below the constructive and destructive interference examples in Fig. 2a are the corresponding interferograms. The result of constructive interference shows what happens when two signals are combined to yield an “amplified” interferogram where phase equals zero. This occurs because anywhere along the combined signals, a measure of zero phase exists. On the other hand, destructive interference shows what happens to the amplitude when phase measurements of 180° occur everywhere along the combined signal.
It’s easy to see from the two interferograms how important phase information can be, and these examples highlight the limitations of broadband seismology and the special case of one-frequency representation.
Exploration applications
“Houston, we have zero phase!” Surprisingly, geophysicists have come to accept the practice of removing and/or failing to collect the most important part of the signal-in other words, we desire zero information about phase.
This is mainly due to the way the information is acquired in the field. Seismic processors routinely use filtering techniques to remove the phase information, leaving interpreters with zero-phase information. This is done because phase information is treated as a valueless component, or noise.
Next look at the results obtained with the use of interferometry to analyze the seismic wave profile of a split beam seismic survey (Fig. 2b). Beam split seismic data properly collected using two different frequencies yield an actual signal containing unique phase intelligence.
This intelligence consists of detailed measurements of phase, and this phase measurement has an accuracy of a single degree or fractional degree of phase. The resulting interference pattern shown as the interferogram in Fig. 2b yields a rich measurement of the key value of phase.
Fig. 2b highlights only a few of the unique phase measurements. For example, some simple measurements taken from the interferogram are 0, 19, 28, 33, 38, 81, 142, and 180. It should be apparent that if all the phase measurements were posted on the figure they would blot out the page.
Exploration interferometry
A seismic field test program consisted of a two seismic lines, one acquired as a typical seismic line and the second as an interferometric version.
The test lines were 6 miles long and acquired simultaneously in 1998 as part of a program in the southern Sacramento basin. Primary exploration targets exist at a pressure boundary near the Lathrop sands.
The Lathrop formation was made famous by a coincidental partnership between two individuals. Gene Reed, a Bakersfield drilling contractor, approached a Russian art dealer in 1962 to drill a well to the Lathrop sands a few miles from the test site. The well discovered Lathrop gas field (360 bcf). The Russian art dealer’s name was Armand Hammer, and the discovery led to the birth of Occidental Petroleum Corp.
The test specifically targeted the seismic characteristics of the Lathrop sands, part of the Cretaceous Winters formation. Lathrop and Winters sands are nearly identical and produce large amounts of gas in the southern Sacramento basin.
Lathrop and Winters have similar depositional settings (configuration) and rock composition. Depositional settings consist of delta and turbidite sequences and facies. The sands are a mixture of quartz and feldspathic sands overlain by Cretaceous aged shales.
Figs. 3 and 4 show detailed wave characteristics of the Lathrop formation on two processed and interpreted seismic lines shot at the same time and place. The Lathrop reflection event lies at 2.2 to 2.3 sec and is characterized by a large red trough and two corresponding smaller black peaks. The yellow lines indicate correlations of localized maximum amplitude about the symmetrical wavelet.
Fig. 3 displays the typical phase measurements of the noninterferometric Lathrop portion of the seismic line. Processors accurately created a zero-phase data set, especially around the Lathrop reflection, as evidenced by the symmetrical wavelet.
Visual inspection of the data suggests the surface of the Lathrop is cut by discontinuities or faults. Possible faults are at locations Fault A and Fault B. Phase measurements taken from the center red trough are plotted on the associated graph. Because the data are zero-phase, little information can be discerned about the Lathrop structure or composition from phase measurements alone.
On the other hand, Fig. 4 presents the phase measurements from the interferometric version of the line over the exact same portion of the Lathrop as in Fig. 3. Phase information as measured from the two frequency profiles (above and below the center graph) made of the same reflected and refracted red trough (Lathrop wavelet) are shown in graphical form.
This graph of phase is very different from Fig. 3. In Fig. 3 nothing is gained from the phase measure of the Lathrop wavelet, but in Fig. 4 the center graph contains useful and dynamic measures of phase. These measures can directly lead to interpretations of rock character and structure.
Fault A is nicely predicted and mapped by the interferometric phase measurement of the event as depicted by the phase change right at the location of the fault. But Fault B does not show up, and there are good indications from the interferometric phase measurements that this may not be a fault at all.
What does show up is the presence of a stratigraphic boundary or compositional change at the top of the Lathrop. The green line in Fig. 4 shows a phase change in the red trough that is very likely a stratigraphic boundary. Though there is some evidence below the Lathrop, deeper in the seismic section, indicating a compositional change, this is not true at the top of the Lathrop. This change is demonstrated at the top of the Lathrop with interferometric phase measurements.
In this example, seismic surface and compositional characteristics of the Lathrop formation can be analyzed and mapped using interferometric phase measurements. Noninterferometric data yield zero phase, nothing, about the phase characteristics of seismic reflections and refractions of Lathrop structure and composition.
Direct hydrocarbon indicators
DHIs are valuable seismic technologies that allow companies to assess the presence of hydrocarbons before drilling.
The three types of DHIs are bright spot, amplitude vs. offset (AVO), and the revolutionary and newly patented phase vs. offset (PVO).
Bright spot
The first and oldest DHI is the technology known as bright spot.
Bright spots are simple amplitude increases on stacked data that are supposed to indicate the presence of hydrocarbons. This technology was developed and used extensively in the 1960s-70s, and geoscientists used it to find shallow gas in many clastic basins.
Even today, many small US independents primarily use 3D bright spots to drill for shallow reserves. This technology when applied to the shallowest gas reservoirs, for example in California and the Gulf Coast, can yield a 50%+ success rate.
AVO
Scientifically, AVO is described as measuring the amplitude of reflective/refracted energy as a function of angle of incidence (or offset).
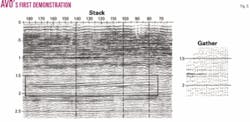
Ostrander, a Chevron employee, received a patent in 1977 that described a revolutionary DHI of amplitude vs. offset (AVO). Ostrander discovered the technique while analyzing seismic data several miles north of the 6-mile test line.
Putah Sink gas field produces from sands of the Cretaceous Winters formation (Fig. 5). Ostrander shows the bright spot associated with the Winters and an amplitude increasing with respect to offset. Reflective units that contained hydrocarbons have varying amplitude measurements with respect to offset and thus became a very recognizable pattern.
AVO showed that analyzing amplitude information with respect to angle of incidence provides a great diagnostic tool to assess hydrocarbon presence and information about rock properties. In Ostrander’s example, the rock properties were that of a gas-charged sandstone.
AVO has limitations in deeper parts of the rock section, in particular below 10,000 ft and above geopressure. In many cases geopressure occurs as shallow as 5,000 ft.
Some independents have boasted success rates as high as 90% with AVO. Typically, though, success rates have improved for this type of reservoir from 10-15% pre-AVO to a modern “wildcat” success rate of 30-50%.
As with any technology, AVO’s limitations abound throughout the geologic section and the world’s exploration provinces. One example is deep geopressured basins.
Geopressure or abnormally high pressure exists in wells where exploration targets exist at 6,000-20,000 ft. These targets are areally or volumetrically small because of the great depths and pressures, and for the same reason they store huge quantities of hydrocarbons.
The larger reserves are packed into small places and are quite hard to find, for one reason because they exhibit Class II AVO responses. In the Class II AVO anomaly the amplitudes across all offsets are very small or low. Thus Class II AVO hydrocarbon reservoirs yield low and undetectable amplitude patterns or responses.
More typically, at such depths the resulting defining amplitudes, when created without the use of phase data, are buried in the seismic noise. This is because, as stated earlier here, explorationists prefer to or are forced to filter out phase information, making such reservoirs effectively transparent in the AVO interpretation.
Phase vs. offset
Phase vs. offset (PVO) is a patented outcome of seismic interferometry that promises to enhance exploration results with regard to Class II AVO reservoirs as did the use of AVO in finding Class III reservoirs.
By mapping phase information from interferometrically compatible seismic surveys, these deep geopressured reservoirs are very likely to be detected.
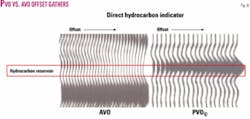
Fig. 6 shows representative “offset gathers” indicative of a deep geopressured hydrocarbon reservoir. This Class II AVO response is due to the rock properties of the gas sands and overlying trapping shales. The left side of Fig. 6 shows the amplitude domain, where the AVO anomaly for the hydrocarbon reservoir is low and small across the offsets.
To the right the PVO of the hydrocarbon reservoir shows large values across the offsets. The PVO for these reservoirs makes a full-cycle change and is a potentially recognizable pattern that “provides the explorationist with a deeper seismic investigative and prediction tool.”
This is a new and exciting dimension in seismic technology. PVO provides measurements that now can be associated with rock properties or lithologies for better detection. Seismic interferometry and phase mapping also have potential in predicting and mapping geopressure zones before drilling.
Acknowledgment
Thanks to Bob Payne (bpayne@ licensingadvisors.com) for contributions to this article, including assistance to the author in licensing SONE Technologies’ patent portfolio. ✦
Bibliography
Ostrander, W., “Method for Interpretation of Seismic Records to Yield Indications of Gaseous Hydrocarbons,” U.S. Ser. No. 756,584, Jan. 3, 1977.
Sansone, S., “Frequency Modulated Seismic,” SEG annual convention, 2001.
Sansone, S., “Seismic Phase, the Next Exploration Frontier,” AAPG annual convention, 2002.
The author
Stan Sansone (sonetech@ houston.rr.com) is an explorationist and inventor. For the past 15 years he has been inventing and developing seismically investigative tools. He was awarded his latest patent for DHI using interferometric techniques on Aug. 30, 2005. He has a BA in physics and mathematics and an MA in geology from the University of Connecticut.
