US OLEFINS - FOURTH QUARTER 2005: Hurricanes disrupt North American olefins industry
New series
This article represents the first of Oil & Gas Journal’s semiannual US Olefins series, which will alternate on a quarterly basis with the US Propane series. Dan Lippe, principal of Petral Consulting Inc., Houston (www.petral.com), is the author of both the propane and olefins series. Beginning with the present article and in future February and August installments, he will discuss movements and trends in the US ethylene and propylene industry at key points in these commodities’ annual cycle.
In the last half of 2005, hurricanes disrupted operations at refineries and gas plants. The loss of feedstock supplies caused substantial problems for the olefins industry on the US Gulf Coast in September and October.
Fires also disrupted operations in three olefin plants in the third and fourth quarters. The fourth quarter was a period of recovery for the US olefins industry.
Although Hurricanes Katrina and Rita caused little direct damage to ethylene plants in Louisiana, they caused substantial damage to offshore oil and gas production facilities and to onshore gas processing plants. Gas plant NGL production in Louisiana was 200-220,000 b/d less than full output during September and October.
The loss of feedstock supply from gas processing plants was equal to 500 million lb/month of ethylene production. Midstream companies and ethylene producers used inventories of ethane and propane in Mont Belvieu, Tex., to offset some of the feedstock supply losses in Louisiana after Katrina. Ethylene producers in Louisiana also used privately held inventories to minimize the impact of feedstock supply losses.
Fires in August and October caused extensive damage to Innovene LLC’s plant at Chocolate Bayou, Tex., and Formosa Plastics Corp.’s plant at Point Comfort, Tex. Eastman Chemical Co.’s plant at Longview, Tex., also had a fire in one of its units in November.
The loss of ethylene production capacity due to fires in the third and fourth quarters was about 4 billion lb, or 6.5% of total industry capacity. Innovene and Formosa expect to complete repairs to their plants and will resume operating at full capacity sometime in second-quarter 2006. Eastman Chemical will complete repairs to the plant at Longview in fourth-quarter 2006.
With no weather-related outages, ethylene plants in Alberta and Ontario were well positioned to operate at full capacity during September-November and to fill the void in production from plants in Texas and Louisiana. A compressor failure at the decompression-recompression station on the Foothills Pipeline occurred in October, however, which limited the availability of natural gas to Empress area straddle plants and reduced ethane supplies for Alberta’s ethylene industry. The decline in feedstock production was a limiting factor for ethylene production in Alberta during October and November.
Olefin plant feedslates
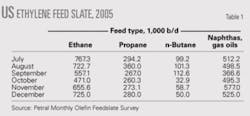
Feedstock flexibility is the hallmark of the US ethylene industry. During the first 90 days after hurricanes caused plant downtime and reduced NGL feedstock availability, ethylene producers in Texas and Louisiana used their feedstock flexibility to restore operations and minimize the impact of production losses.
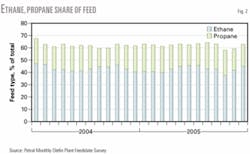
Usually, ethane and propane account for 63-68% of the industry’s fresh feed and 65-70% of ethylene production. Ethane and propane accounted for 72% of fresh feed in September but only 61% in October.
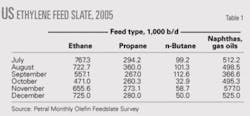
Table 1 shows recent trends in olefin plants’ feed slates.
Even though multi-feed crackers operated at less than 70% of capacity during October and November, the use of heavy feeds surged to near record-high volumes after September. This shift in feed slates enabled producers to boost coproduct propylene supply to 85% of normal output in October and about 97% of normal output in November.
Ethylene plants will run at capacity during fourth and first quarters to make up for production losses during September and October. Propylene prices, however, are likely to continue weakening during first-quarter 2006. The decline in propylene prices will significantly improve incremental economics for ethane.
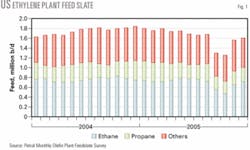
Figs. 1 and 2 show historic trends in ethylene feed slates.
null
null
Ethylene production
Our monthly survey of ethylene plant operations and feed slates allows us to track ethylene production from olefin plants. Ethylene production volumes from our survey are almost always somewhat less than the volumes reported by the National Petrochemical & Refiners Association.
We use statistics provided by Statistics Canada to track total ethylene production in Canada. We use ethane production data from the Alberta Energy and Utilities Board and pro-forma yield patterns to develop breakout estimates for ethylene production in Alberta and eastern Canada.
US ethylene production
Ethylene production from olefin plants was 12.6 billion lb in the third quarter. Production was 1.2 billion lb less than in the second quarter.
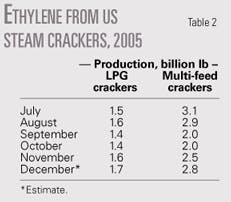
Most of the production decrease in the third quarter occurred in September due to downtime caused by Hurricane Katrina. Feedstock supply curtailments and hurricane-related downtime continued to limit ethylene production during October and November but output recovered to 95% of pre-storm volumes in December (Table 2).
LPG crackers accounted for 36% of total ethylene production in the third quarter and operated at 80% of nameplate capacity. In fourth-quarter 2005, LPG crackers accounted for 39% of production and operated at 85% of capacity.
Multi-feed crackers accounted for 64% of production and these plants operated at 80% of capacity in the third quarter. In the fourth quarter, multi-feed crackers accounted for only 61% of production and operated at 75% of capacity. All of the capacity lost due to fires involved multi-feed crackers.
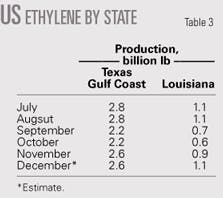
Katrina and Rita reduced ethylene production in Louisiana by 42% in September and 45% in October (Table 3). Production losses in Louisiana during September-November totaled 1.2 billion lb and accounted for 44% of total lost production and 62% of hurricane-related production losses.
In contrast, downtime on the Texas Gulf Coast reduced production 21% in September and 23% in October. Production losses from the fire-damaged facilities accounted for almost half of the industry’s production losses on the Texas Gulf Coast during September-November.
Canadian ethylene production
Estimated ethylene production in Alberta (based on ethane availability and pro-forma yield patterns) were 2.15 billion lb in the third quarter. Production in Alberta was slightly higher than in the second quarter. Production will be 2.5 billion lb in the fourth quarter.
Ethylene production in Eastern Canada was about 0.5 billion lb in the second quarter of 2005. Although Statistics Canada data for the third quarter is incomplete, ethylene production in eastern Canada was about 0.45-0.50 billion lb in the third quarter. Total ethylene production in Canada for 2005 will likely be 10.8-11.0 billion lb.
US propylene production
Downtime at ethylene plants and refineries in Louisiana reduced both coproduct production and merchant propylene sales from refineries in September and October.
Steam crackers
In second-quarter 2005, coproduct propylene production from olefin plants was 3.3 billion lb. In response to weak propylene prices, most ethylene producers adjusted feed slates to reduce coproduct propylene yields during second quarter.
These trends continued during July and August, when production was on track to total 3.3 billion lb during third quarter vs. 3.6 billion lb in first quarter.
Multi-feed crackers account for 80% of total coproduct supply; adjustments to feed slates in these plants should have a greater impact on propylene production than LPG crackers. Coproduct propylene production, however, declined in LPG crackers and multi-feed plants after propylene prices collapsed in May.
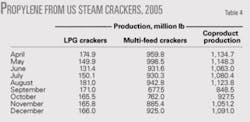
Table 4 shows trends in coproduct propylene production from LPG and multi-feed plants.
Although adjustments to feed slates had some impact on coproduct propylene, the hurricanes disrupted ethylene plant operations in southeast Louisiana, Lake Charles, and Beaumont-Port Arthur-Orange during September and October; coproduct production fell sharply in September and October.
All ethylene plants outside the US Gulf Coast use primarily ethane and some propane as feedstock. Coproduct production from these plants is therefore relatively low and accounts for less than 3% of total coproduct supply. Furthermore, ethylene plants along the Texas Gulf Coast generally account for 75-78% of total US Gulf Coast production.
Table 5 shows trends in coproduct propylene production from plants in Texas and Louisiana.
In third-quarter 2005, propylene production from olefin plants in Texas averaged 856 million lb in August but declined to 697 million lb in September due to widespread shutdowns during the last week of the month. Propylene production in Louisiana also declined during September and the decline was more severe than in Texas.
Adjustments to feed slates in all olefin plants helped minimize the impact of downtime after Katrina and Rita. Coproduct production was 95% of pre-storm levels in November.
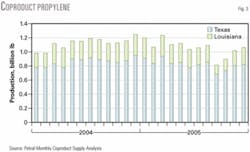
Fig. 3 shows trends in coproduct propylene production from olefin plants in Texas and Louisiana.
Refinery propylene supply
During second quarter, the refinery industry’s merchant propylene sales totaled 3.99 billion lb. The collapse in refinery propylene prices in May reduced the economic incentive to maximize merchant propylene sales.
Despite the collapse in spot prices for refinery-grade propylene, merchant propylene sales were 3.62 billion lb in third quarter. If Katrina had not disrupted refinery operations in Louisiana in September, production would have been 3.82 billion lb in third quarter or less than 0.2 billion lb off of production during third-quarter 2004.
Refineries in Beaumont-Port Arthur and Lake Charles began to recover from the aftermath of Rita in mid to late October. Merchant propylene sales remained weak and totaled only 1.09 billion lb.
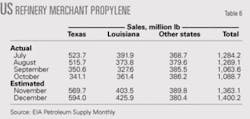
Based on refinery crude runs and fresh feed to FCCs (the primary source of refinery propylene), refinery operations along the Texas Gulf Coast and in Lake Charles were at their lowest in October. Refinery merchant propylene sales are likely to be sharply higher in November and December (Table 6).
In November and December, refinery merchant sales of propylene will be 1.36-1.40 billion lb/month and production in the fourth quarter will total 3.80-3.85 billion lb.
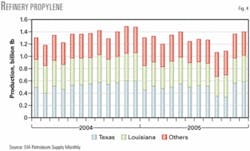
Fig. 4 shows trends in refinery merchant propylene sales.
Propylene inventories
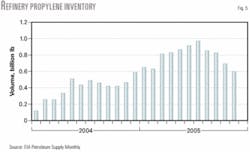
On Jan. 1, 2005, inventories of refinery-grade propylene were nearly 600 million lb. Inventories of refinery-grade propylene increased steadily during the first and second quarters and totaled nearly 1 billion lb at the end of July.
In September 2005, production losses due to refinery downtime totaled about 200 million lb. Downtime at various propylene derivative units simultaneously reduced propylene demand, however, and inventories of refinery-grade propylene declined by only 27 million lb in September.
Propylene demand rebounded in October but refinery and olefin plant downtime continued to limit production during October and November. Inventories declined 130 million lb in October and 100 million lb in November. Despite all the problems after August, inventories of refinery-grade propylene totaled 600 million lb on Dec. 1, 2005, and about 700 million lb on Jan. 1, 2006.
Fig. 5 shows trends in refinery-grade propylene inventories.
Ethylene economics, prices
Feedstock prices, coproduct values, and ethylene plant yields determine ethylene production costs. We maintain direct contact with the olefin industry and track historic trends in spot prices for ethylene and propylene. We use a variety of sources to track trends in feedstock prices.
Some ethylene plants have the necessary process units to convert all coproducts into high-purity streams. Some ethylene plants, however, do not have the capability to upgrade mixed or crude streams of various coproducts; they sell some or all their coproducts at discounted prices. We evaluate ethylene production costs in this article based on all coproducts valued at spot prices.
Ethylene production costs
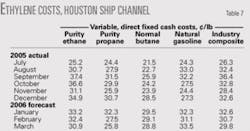
During third quarter, the surge in feedstock prices pushed the composite production cost to 36¢/lb in September from 26¢/lb in July. Feedstock prices stabilized in October and then began to decline in November; the composite production cost declined to 33¢/lb in October and 28¢/lb in November.
Feedstock prices rebounded in December and spot prices for propylene and other coproducts remained under downward pressure. The Houston Ship Channel composite production cost rebounded to 32-33¢/lb in December and will average 30-33¢/lb during first-quarter 2006.
Table 7 summarizes trends in ethylene production costs.
Ethylene prices, profit margins
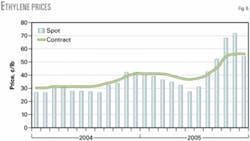
During second quarter 2005, ethylene inventories increased 254 million lb to a total of 1.35 billion lb or 9 days of production at the end of June vs. 1.09 billion lb or 7 days of production at the end of March. Even though inventories remained under control, downward pressures on spot prices were persistent during the second quarter. In June, spot prices fell to a low of 25¢/lb for a few small-volume transactions.
The steady decline in spot prices and contract settlements ended abruptly in August when the fire at Innovene’s Chocolate Bayou plant disrupted supply along the Texas Gulf Coast. Producers and buyers began to scramble to cover their requirements to make up for production losses.
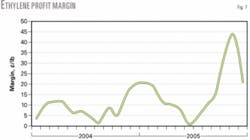
Further production losses occurred due to hurricanes and the fire at Formosa’s plant. Panic buying pushed contract settlements and spot prices higher during October and November. Spot prices for ethylene peaked at 74¢/lb in mid-November.
The surge in spot prices for ethylene quickly pushed prices higher for the major derivatives and the spike in prices began to affect international trade. Although a rare occurrence, one waterborne cargo of ethylene was scheduled for shipment to the US Gulf Coast from Asia. During late November through mid December, spot prices collapsed and were 53-54¢/lb at the end of December.
Figs. 6 and 7 show trends in ethylene prices and profit margins.
null
null
Propylene economics, prices
Supply and demand factors and economics caused substantial swings in propylene prices during the second, third, and fourth quarters 2005. Our analysis of propylene prices focuses on price trends and value relationships for refinery-grade propylene.
Propylene marketers derive prices for chemical grade and polymer propylene based on the cost of fractionation. Chemical grade and polymer-grade propylene prices are consistently 3-5¢/lb higher than refinery-grade propylene prices.
Robust refinery merchant sales during fourth-quarter 2004 and first-quarter 2005 led to a growing inventory surplus during the first and second quarters 2005. The inventory surplus and seasonal increase in refinery merchant sales sparked a collapse in refinery-grade propylene prices during the second quarter.
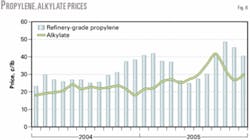
Spot prices fell to a low of 25-26¢/lb during June and July from about 41.5¢/lb in late February and early March. Most of the decline in refinery-grade propylene prices occurred in May when major refinery-grade propylene buyers reduced contract prices 8¢/lb. Despite the collapse in refinery-grade propylene prices, inventories continued to increase during June and July.
In September, refinery merchant sales fell 25% and inventories finally began to decline. In response to the surge in spot prices for gasoline and alkylate, spot prices for refinery-grade propylene jumped to 45¢/lb in late September from 31¢/lb in late August. Spot prices for refinery-grade propylene reached a peak for the year in early October at 52¢/lb but began to decline in late October and fell to less than 40¢/lb in mid December.
Octane values
We evaluate the relative strength of spot prices for refinery-grade propylene by comparing them to US Gulf Coast spot prices for alkylate, a gasoline octane blendstock that is widely traded among Gulf Coast refiners. The relationship between spot prices for refinery-grade propylene and alkylate is a leading indicator that signals swings in refinery merchant sales.
Fig. 8 shows trends in spot prices for refinery-grade propylene and alkylate.
Before refinery-grade propylene buyers cut contract prices sharply in May, spot prices in March and April were about 10-12¢/lb higher than alkylate prices. After the collapse in contract prices in May, spot prices averaged 2-3¢/lb less than alkylate values during June and July. The discount versus alkylate widened to about 6¢/lb in August.
The loss of refinery merchant sales after Hurricane Katrina rescued the propylene market in September. Spot prices for refinery-grade propylene jumped to parity vs. alkylate in September.
Hurricane Rita prolonged the loss of production in September and October; spot prices for refinery-grade propylene jumped to premiums of 16¢/lb and 18¢/lb vs. alkylate in October and November, respectively.
Outlook
For every price spike there is an equal and greater price collapse unless a fundamental shift in the supply-demand balance has occurred. Price trends during third and fourth quarters 2005 validated this principle.
In first-quarter 2006, spot prices for ethylene and propylene are likely to continue to reinforce the notion of an equal or greater decline following the price spikes in September and October. The price spikes were sufficient to cause changes in international trade patterns for ethylene derivatives, propylene, and propylene derivatives, and for ethylene itself.
For a few months, petrochemical exports will decline sharply and North America will receive imports from unusual sources. The changes in international trade patterns will be temporary, however, and will return to normal when pricing relationships return to normal.
Price forecasts for ethylene and propylene are based on spot prices for West Texas Intermediate crude in the range of $55-60/bbl during the first and second quarter. Octane values will be weaker in first and second quarters 2006 vs. 2005.
We forecast that ethylene prices will average 52-53¢/lb in the first quarter but will decline to 40-42¢/lb by June 2006. Spot prices for refinery-grade propylene will average 32-35¢/lb during first and second quarters. At this level, refinery-grade propylene prices will maintain premiums of 1-4¢/lb vs. alkylate prices.
The author
Dan Lippe is president of Petral Cos., Houston. In 1974, he began working for Diamond Shamrock Chemical Co. in a variety of technical and plant-management positions. He began his consulting career at Pace Consultants in 1979 and was employed by Resource Planning Consultants as a partner 1981-86. After RPC’s merger with Bonner & Moore, Lippe served as manager of NGL studies until 1988. He holds a BS in chemical engineering from Texas A&M University and an MBA from Houston Baptist University. He is a member of GPA and chaired its NGL Market Information Committee 1992-94 and 1996-2000.
