Compositional model improves gas-lift optimization for Iranian oil field

A simulation with a compositional model improved the accuracy when compared with a black-oil model for predicting the performance of gas-lift wells in the Aghajari oil field in Iran.
The Marun oil field gas compressor station supplies the lift gas, which is drier and has a lower molecular weight than the gas from the Aghajari field separators. These differences in gas cause inconsistencies in black-oil model calculations.
The black-oil method is fast but not accurate when one must take into account compositional differences.
The study evaluated the gas-lift system with black oil and compositional models combined with multiphase flow correlations. The compositional modeling employs the Peng-Robinson equation of state (PR EOS) for rigorous thermodynamic and physical properties evaluation.
Gas lift
Gas-lift systems have a significant impact on the facility design. High-pressure gas injected into a well lightens the fluid column and allows fluid to flow to the surface. The injected gas combines with the produced reservoir fluid and enters a low-pressure separator system. The low-pressure separator must have sufficient gas-separation capacity to handle lift gas as well as the gas from the producing formation.
Gas lift should produce to a separator that is operated at the lowest practical pressure. Surface backpressure would restrict the production from a well with continuous-flow gas lift.
Knowing whether or not the well must be unloaded into the system pressure or into a lower pressure is important in gas-lift design. Horizontal flow correlations can obtain the necessary pressure to produce at the desired fluid rates from the wellhead to the separator.
As in a flowing well, the variables that affect producing rates in continuous-flow gas lift can be classified into two groups:
- Those that can be controlled.
- Those with little or no control.
The first group includes flow line size and length, tubing size and length, surface restrictions, and separator pressure. The second group includes the fluid properties, the reservoir static pressure, and the inflow ability or productivity index.
Aghajari oil field
Aghajari field was discovered about 70 years ago in southwest Iran. In the mid 1970s, peak oil production was slightly more that 1 million b/d with oil production stabilizing at about 800,000 b/d for more than 15 years.
The oil field contains five production units, three NGL plants, three gas compressor stations, and a gas-lift ring. The gas-lift ring, installed in 1978, distributes the gas among more than 60 wells out of 165 existing producing wells.
The lift-gas source is the Marun oil field gas-injection compressor station. This gas is drier than the separated gas from Aghajari. The difference in the composition of the lift gas and associated gas causes inconsistencies in the black-oil simulation model, evaluated in this article.
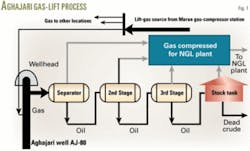
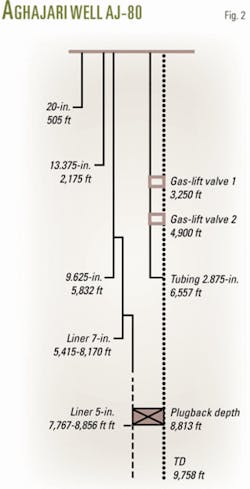
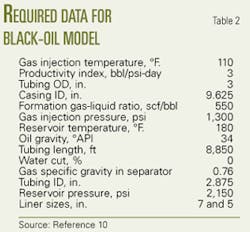
Fig. 1 shows the Aghajari gas-lift system. Most wells flow up the annulus of a 5 or 7 in. liner and 95/8 in. casing. Lift gas is injected into a 6,557 ft long, 27/8 in. tubing string (Fig. 2).
Aghajari currently produces almost 180,000 bo/d.
On the basis of recent studies, reservoir pressure maintenance and the use of gas lift are the best mechanisms for improving oil recovery from this field. A newly designed project aims to deliver 3 bcfd of gas from South Pars gas field to inject gas in the Aghajari oil field for pressure maintenance. Initially the gas will increase reservoir pressure up to 2,900 psig in the first phase and to 3,600 psig in the second phase.
The South Pars gas pool is part of the largest gas reservoir in the world and is in the southern part of Persian Gulf. The field is shared with the neighbor country, Qatar, and transferring such large amounts of gas is expected to boost Aghajari oil production as well as store the gas in the central part of the Iran for future needs.
Black-oil model
The black-oil method is extensively used for evaluating oil production. A black oil, pressure-volume-temperature (PVT) model defines the fluid in terms of stock-tank oil, gas gravities, and phase ratios. Several industry standard correlations can describe the fluid properties as a function of pressure and temperature.
In a black-oil PVT model, the total volumetric flow rate of each phase is the sum of all the contributing flows from the sources.
Black-oil models describe hydrocarbons as two components, oil and gas, and assume that hydrocarbon fluid composition remains constant during the simulation. The model also assumes that all fluid properties can be determined from the oil pressure and bubblepoint pressure.
The model normally describes all mass transfer between the two components with the solution gas-oil ratio term, Rso, although an oil-in-gas term to handle condensate may be included easily in the black-oil model.1-3
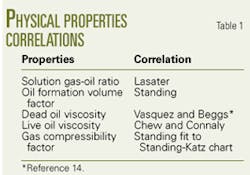
For calculating pressure drop, one can use the PVT data for inputting into the appropriate correlations for fluid properties and multiphase flow. Table 1 shows the correlations used in this study for the calculation of fluid properties such as solution gas-oil ratio, oil formation volume factor, oil viscosity, and gas compressibility factor.4
Compositional models
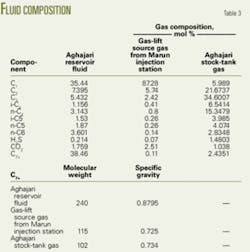
Compositional simulations based on full component flash calculations are time consuming for most applications. Component lumping is one way for speeding up the flash calculations. This was done in this study of the Aghajari gas-lift system (Table 3).
This method replaces the original components with a few pseudocomponents with averaged properties. This will speed up the calculations but the accuracy will deteriorate as the number of pseudocomponents decrease.
The fluid in a compositional analysis is described in terms of components (such as C1, C2, H2S), their properties (such as molecular weight), and the fluid composition. The stock-tank oil and gas volumes depend on the separator configuration, and therefore the stock-tank volumetric flow rate of each phase in the system will not necessarily be the sum of the individual contributions from all sources.
In reservoirs containing light oil, the hydrocarbon compositions as well as pressure affect fluid properties. One must use equilibrium flash calculations from K values and the equation of state (EOS) to determine the hydrocarbon phase compositions.
In a compositional model, in principle, one makes a mass balance for each hydrocarbon component, such as methane, ethane, propane, etc. In practice, the procedure is to limit the number of components included and then group the components into pseudocomponent mathematical material.
The number of equations that must be solved in compositional simulation depends on the number of components modeled. Often, one models the lighter components individually and groups heavier components into a pseudocomponent.
If nonhydrocarbons are involved, one may also have to model these separately.1 5 6 This gas-lift study uses a PR EOS in the compositional model.7
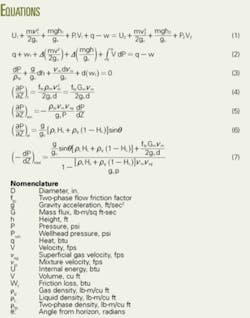
The calculations are based on the first law of thermodynamics and the energy balance between the two points of fluid flow. The result is Equation 1 (see equation box).4 8
Rearranging Equation 1 provides Equation 2. Equation 3 is then obtained for two-phase flow by rewriting Equation 2.9
Equations 4-6 determine the pressure drop due to friction loss, acceleration loss, and as elevation changes through the piping system. Equation 7 expresses the overall pressure drop.
Analysis
Based on the black oil and compositional models, this study used Pipesim software for analyzing the production system and determining the vertical multiphase-flow pressure drop in a well.7
The vertical multiphase-flow correlation requires the well profile, production rate data, and surveys of bottomhole pressure and temperature. After these data were entered into the modeling computer software, Pipesim calculated the well performance curve for different separator pressures. These curves are determined from the pressure traverse with an appropriate multiphase flow correlation.
In the second stage to determine the expected production rates for injected gas rates at various separator pressures, the study applied the appropriate fluid properties’ correlations and the appropriate vertical multiphase flow correlations.
After determining different wellhead pressures for the well from actual pressure and temperature surveys, the analysis constructed gas-lift performance curves for the well. A comparison between the actual data and results determined the most appropriate method for analyzing the gas-lift performance.
The average reservoir pressure or bottomhole pressure always remains fixed and does not vary with the flow rate.
In the analysis, constructed curves for different separator pressures show the gas-lift performance.
null
Tables 2 and 3 list the required input data for optimizing the gas lift.10 Needed data include well profile, production rate, bottomhole flowing pressure, average reservoir pressure at mid-perforation, and surface gas-lift pressure.
The analysis calculated the production rates as a function of gas injection rates using the appropriate fluid properties prediction models (black oil and compositional) and the vertical multiphase-flow correlation.
Optimum well performance is the maximum production rate with minimum injected lifting gas. Well performance depends on production tubing size and injected gas lift rate, but the production tubing size is already in the well and its size was included in the optimization procedure.
The injected gas lift rate was the only remaining parameter left for optimization with the following steps:9 11-13
- Select the appropriate fluid simulation model (black oil or compositional) and multiphase flow correlations.
- Calculate the pressure traverse inside the casing for the formation oil and associated gas.
- Determine the separator pressure for a given system.
- Assume an injected lift gas rate in the casing.
- Calculate well production rate in the casing from an assumed injected gas and separator pressure.
- Change the injected gas rate and repeat the calculations (Step 4).
- Construct the performance curve, production rate as a function of injected gas for different separator pressures (Step 3).
- Determine the optimum production rate and the optimum injected gas from various wellhead separator pressures.
Results
The black-oil model assumes that the light component is identical to the gas from the separators while the heavy component is identical to the stock-tank oil. The difference with the black-oil model seems in the first instance not too great, but the difference plays an important role when one mixes different compositions.
Mixing two components, which have a different stock-tank gas or oil composition, introduces inconsistencies in the black-oil model.
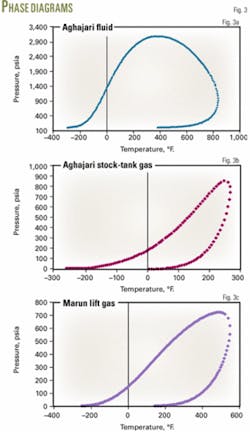
Fig. 3a shows the phase envelope for the Aghajari oil field reservoir fluid composition, and Figs. 3b and 3c show that the composition of injected lift gas (Marun gas-injection station gas) has differences from the Aghajari gas composition (Table 3).
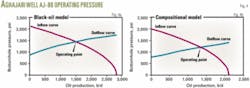
Figs. 4a and 4b show the operating point for Aghajari Well No. 80 (Fig. 2). The figures indicate that if the separator pressure is set to 200 psig and for a 2.4-MMscfd lift-gas injection, the black-oil model calculates a 1,600-b/d production rate while the compositional model calculates 1,450 b/d. The practical result is 1,500 b/d.
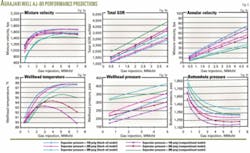
Fig. 5a demonstrates the Aghajari typical well’s performance curve for different separator pressures with the black-oil and compositional models. For a lower lift-gas rate, the performance of both fluid models is the same but for higher gas-injection rates the precision of the compositional model is better.
The differences between the lift gas and produced gas and the accuracy of EOS for predicting fluid properties for higher injection rates are the main reasons for the models providing different answers.
Figs. 5b and 5c compare the calculations of both models to predict total gas-oil ratio and the two-phase mixture velocity in the well annulus.
Figs. 5d and 5e show the wellhead temperature and pressure for different separator pressures and fluid models. A reduced fluid residence time in the annulus causes the increased wellhead temperature at the higher injection gas rate, and the slope of the curve decreases because of lower production rates.
Fig. 5f indicates that increasing the injected lift gas from its optimum value does not affect bottomhole pressure. This graph also shows the effect of wellhead separator pressure. For a higher separator pressure, the required bottomhole pressure is greater for the optimum injected gas and production rate.
Acknowledgment
The authors acknowledge the department of petroleum engineering at the National Iranian South Oil Co. (NISOC) for giving permission to present this work.
References
- Mattax, C.C., and Kyte, R.L., Reservoir Simulation, Richardson, Tex.: SPE Monograph Series, 1990.
- Skjæveland, S.M., and Kleppe, J., Recent Advances in Improved Oil Recovery Methods for North Sea Sandstone Reservoirs, SPOR Monograph, Stavanger: Norwegian Petroleum Directorate, 1992.
- Ferrer, A.A., and Maggiolo, R., “Use of computerized model in the optimization of continuous gas lift operations,” Paper No. SPE 21641, SPE Production Operations Symposium, Oklahoma City, Apr. 7-9, 1991.
- Brill, J.P., and Beggs, H.D., Two Phase Flow in Pipes, Tulsa, Okla.: Tulsa University, 1984.
- Salisburg, P.E., and Peden, J.M., “Compositional Two-phase Vertical Lift Performance Modeling of Crude Oil and Retrograde Gas-Condensate Wells,” Paper No. SPE 16925, SPE 62nd ATCE, Dallas, Sept. 27-30, 1987.
- Palke, M.R., and Horne, R.N., “Nonlinear Optimization of Well Production Considering Gas Lift and Phase Behavior,” Paper No. SPE 37428, SPE Production Operations Symposium, Oklahoma City, Mar. 9-11, 1997.
- PIPESIM User’s Guide, Version 1.3, Baker Jardine and Associates, 2001.
- Brown, K.E., The Technology of Artificial Lift Method, Vol. 4, Tulsa, Okla.: Pennwell Publishing Co., 1984.
- Bahadori, A., Ayatollahi, S., and Moshfeghian, M., “Simulation and Optimization of a Continuous Gas Lift in the Aghajari Oil Field,” Paper No. SPE 72169, SPE Improved Oil Recovery Conference, Kuala Lumpur, Oct. 8-9, 2001.
- Bahadori, A., Simulation and Optimization of Continuous Gas Lift System in the Oil Fields, MSc Thesis, Shiraz University, July 2000.
- Bahadori, A., Ayatollahi, S., and Moshfeghian, M., “Simulation and Optimization of Gas Lift,” JPT, May 2002, p. 60.
- Ayatollahi, S., Bahadori A., and Moshfeghian, M., “Method optimizes Aghajari oil field gas lift,” OGJ, May 21, 2001, p. 47.
- Ayatollahi, S., Tauseef, S.M., and Guzman, C., “Compositional model optimizes gas lift,” OGJ, Jan. 10, 2005, pp. 37-42.
- Vasquez, M., and Beggs, H.D., “Correlations for Fluid Physical Prediction,” JPT, June 1980, pp. 968-70.
The authors

Alireza Bahadori ([email protected]) is a senior process engineer with the National Iranian South Oil Co., Ahwaz, Iran. His work involves artificial lift design, production optimization, and facilities engineering. Bahadori has a BSc in chemical engineering from Petroleum University of Technology, Abadan, Iran, and an MSc in chemical engineering from the University of Shiraz, Iran He is a member of the Iranian Petroleum Institute and the Iranian Association of Chemical Engineers.

Khalil Zeidani is a PhD candidate in petroleum engineering at the University of Alberta, Edmonton. Previously, he worked as a control instrument services technologist and process Engineer for NIOC. His work involved emulsion flow through porous media, multiphase flow in fractures, desalting systems, and gas injection plants. Zeidani has a BSc in chemical engineering from the Petroleum University of Technology of Iran and an ME in reservoir engineering from the University of Calgary.