Simulation predicts condensate formation in Aghar field
A compositional program in a dynamic mode simulated multiphase flow through porous media and predicted condensate formation in a gas-condensate reservoir in southern Iran’s Aghar field.
The study used the sequential method for treating both thermodynamic and fluid flow so that the pressure-volume-temperature (PVT) condition in each time step determined the fluid flow parameters for the next time step.
The simulation showed the effects of liquid dropout in the near wellbore and the program’s flexibility allows for its use in such other processes as gas cycling to clean the wellbore from liquid dropout.
Gas-condensate reservoirs
Gas-condensate reservoirs are common in the Middle East. These reservoirs exhibit complex phase and flow behaviors because of condensate banking in the near wellbore and dynamic compositional changes of each phase. Accurate forecasts of gas-condensate reservoir performance with a numerical simulator require a good understanding of the gas composition’s effect on the flow and phase-behavior properties.
Production rate, fluid properties, and reservoir characteristics such as absolute permeability, relative permeability, wettability, initial reservoir pressure, and temperature influence the behavior of these reservoirs.
Production from these reservoirs causes a decrease in reservoir pressure that leads to liquid dropping out in the reservoir. The phenomenon occurs first in the vicinity of the wellbore and then propagates outward into the reservoir. The most important effect of liquid formation is the reduction of gas relative permeability, which in turn lowers gas production rates.
Evaluation technique
The study investigated gas-composition effects on liquid blockage, relative permeability changes, and hence the decrease in gas production rates.
The analysis used HYSYS, a commercially available simulator that allows user customization for estimating the fluid properties and the PVT calculation for each time step at each node. Besides a rigorous thermodynamic and physical property evaluation, the analysis employed a sequential approach for combining the thermodynamic and fluid flow part of the program.
The field compositional data from a gas-condensate reservoir in the Aghar field confirmed the results.
Literature shows that a single phase, multicomponent system can be used to calculate gas-condensate reservoir performance. But because two-phase flow in the near wellbore region plays an important role in the blockage, this approach is not entirely correct.
Another approach is to mimic the gas-condensate reservoirs with a pseudobinary model. Estimating thermodynamic behavior, such as composition changes of the gas and condensate phases, with a binary model is inaccurate.
As a result, two-phase flow in gas-condensate reservoirs could be described better with an equation of state for calculating the thermodynamic properties and phase behavior, for example, flash calculations at each stage.
Prediction of well deliverability and calculation of gas and liquid recovery require a detailed knowledge of the relative permeability and liquid banking. This study uses Corey’s correlation for estimating the relative permeability of each phase.1
Roussennac documented phase changes during depletion with a numerical simulation procedure.2 According to Roussennac, during the drawdown period, with the liquid building up in the well grid cell, the overall mixture in that cell becomes richer in heavy components and the fluid behavior changes from the initial gas-condensate reservoir conditions to a volatile oil with a higher critical temperature.
Pressure depletion below the dewpoint pressure causes the formation and buildup of condensate, so that the near wellbore region, which has the largest pressure drop, is expected to be a place where condensate banking forms. This process is not a steady-state condition because of the nature of condensate dropout.
The study described in this article, used a one-dimensional cylindrical core simulation to understand dynamically the condensate banking in the near wellbore region. A novel approach with tank and valve options of HYSYS modeled the formation, accumulation, and movement of condensate through the porous media.
These features allowed for calculating changes in the condensate and gas phase composition near the wellbore. The calculation also considered the slip phenomenon because gas flowing in each node is not necessarily in equilibrium with adjacent liquid in the same node. Valves in the HYSYS model controlled movement of each phase according to the modified Darcy law.
The adherence of condensate to pore walls causes condensate accumulation in the pore space. Because of this, a flash calculation with the original gas composition underestimates the amount of liquid dropout.
The study, therefore, considered connate liquid condensate as the irreducible liquid phase saturation to compensate for this shortcoming.
Condensate buildup behavior
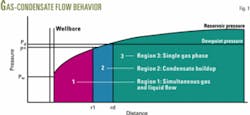
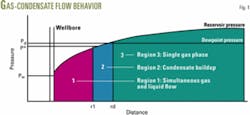
The three-region theory characterizes gas-condensate flow in the near wellbore region (Fig. 1).3
The outer part, Region 3, in which the reservoir pressure is greater than the dewpoint pressure, has single-phase gas flow.
Region 2, in the middle, has a reservoir pressure lower than the dewpoint pressure. Liquid starts to dropout in this region, but the condensate is immobile.
The reservoir pressure is much below the dewpoint pressure in Region 1, the part of the reservoir nearest the wellbore. In this region, if accumulated condensate exceeds a threshold saturation or critical condensate saturation, both gas and condensate may flow into the wellbore.
Gas-condensate simulator
The study used Darcy’s law and the continuity equation combined with PVT calculations based on the equation of state to simulate gas and liquid flow in the porous media. HYSYS was the core program for the thermodynamic part of the simulator for prediction PVT properties on a dynamic basis.
As previously mentioned, combination of tanks and valves in HYSYS controlled the fluid flow equation based on the modified Darcy equation for multiphase flow in porous material.
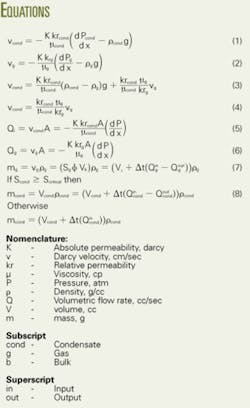
One can assume that the effect of capillary forces is negligible between oil and gas in the gas-condensate zone because of miscibility conditions and the presence of a thin oil film in the pores and throats invaded by gas. One can then combine Equations 1 and 2 (see the equation box) by neglecting the capillary pressure terms to arrive at Equation 3.
For a horizontal model, Equation 3 becomes the simpler Equation 4.
Corey’s expression predicts the relative permeability.1
Computer implementation
The study adopted a multistep procedure, known as a quasi-steady method, to predict the gas production history as well as the condensate-saturation profiles.4 A summary of the simulation steps, based on the combination of the continuity equation, Darcy’s law, and the equation of state, are as follows:
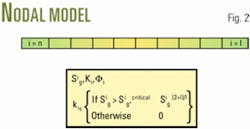
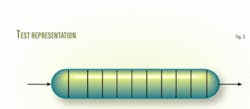
- The selected part of the system for this investigation (Fig. 2) is a cylindrical core divided into a number of segments of equal length, ΔX, and the required input and output data.
- A time step, Δt, is selected. This time step is shorter than the anticipated time required for a specific gas saturation to move over a distance of length ΔX for reaching to next node.
- Any segment of length ΔX can be identified by its own characteristics, such as permeability and porosity, as well as the oil relative-permeability correlation (Fig. 2). This enables one to study the gas-condensate system in a heterogeneous medium involving different combinations of layers in series.
- The gas-saturation profile at the beginning, for example time = 0, is 100% for all nodes. For the next time step, the condensate saturation is set to the previous value at each node in the direction of flow (Step 7). After determining the phase saturation, the simulator calculates the pressure of each node by solving the pressure equation for all nodes with the pressure flow solver in HYSYS software.
- After calculating the condensate-saturation profile, the simulator provides the relative permeabilities with Corey’s correlation. This facilitates calculation of the volumetric flow for each node with Equations 5 and 6.
- A mass balance for the gas phase for each segment using the outcomes of Step 5 and 4 calculates the amount of prior accumulated gas in each node in the new time step (Equation 7).
- If the condensate saturation in each node in the previous time step exceeds the critical value, the amount of previously accumulated condensate in each node for the new time step is found using the continuity equation for the condensate phase for each segment, as mentioned previously for the gas phase in Step 6. Otherwise the exit volumetric flow rate for the condensate phase is set to zero (Equation 8).
- After calculating of the thermodynamic properties of each phase in all nodes by flash calculation, the simulation proceeds to the next time step, Δt, until it reaches the required time limit. The production history, oil and gas saturation profiles, as well as the nodal gas pressure are calculated using this procedure.
Dynamic simulation of the program requires two boundary conditions either pressure or volumetric gas flow rate. The selection of each of these two parameters as the boundary condition allows for the calculation of appropriate parameters.
The two-phase flow near the wellbore cannot be considered as Darcy laminar flow because of the high gas and liquid flow rates. Although this simulator is based on the Darcy law and laminar two-phase flow, it can handle turbulent conditions by changing the governing equation used in the program.
The program can simulate any other two-phase reservoirs such as oil reservoirs with solution gas. Its application is not restricted to gas-condensate reservoirs.
Result of simulation
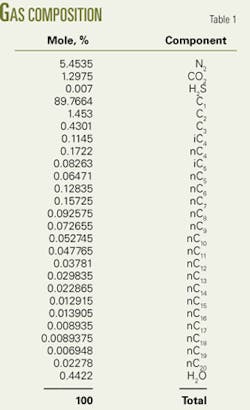
Data from the Aghar field, a natural gas field in southern Iran, illustrate the use of the model. The field’s estimated reserves are 440 billion cu m of gas and current production is 22 million cu m/day. Table 1 shows the gas composition.
The results of the simulation could be used in any future development plan of this reservoir, such as determining the optimal gas production rate or gas cycling to clean the condensate blocks near the wellbore.
Fig. 3 illustrates the flow conditions.
The pressure drop across the core of the simulator provides the amount of gas passing through the nodes. Besides, the simulator also calculates the condensate saturation profile, pressure, and volumetric flow rate trajectory for each phase. Table 2 summarizes the required parameters.
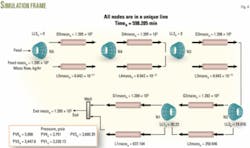
An animated file (.avi) provides a view of gas and condensate mass flow rates, condensate saturation in each node, and the pressure profile as a function of time. Fig. 4 shows the last frame of this animated file.
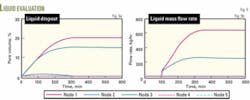
Condensate forms in only Nodes 1, 2, and 3 (Fig. 5a). This condensate remains immobile until the critical condensate saturation, which is set at 10% in this calculation. As shown in Fig. 5b, the mass flow rate of the condensate from Node 1 and 2 is zero because the amount of condensate is less than the irreducible saturation.
As a result of condensate formation, the gas mass flow rate decreases by 15% because of the gas relative-permeability reduction in the wellbore (Fig. 6a).
Fig. 6b shows the calculated pressure profiles. Note that the pressure of Node 5 remains constant because of the assigned fixed pressure drop.
References
- Corey, A.T., “The Interrelation Between Gas and Oil Relative Permeabilities,” Production Monthly, November 1954, pp. 38-41.
- Roussennac, B., Gas Condensate Well Test Analysis, MS thesis, Stanford University, 2001.
- Fevang, O., and Whitson, C.H., “Modeling gas-condensate well deliverability,” SPE Reservoir Engineering, November 1996, pp. 221-230.
- Chatzis, I., and Ayatollahi, S., “Investigation of the GAIGI process in Stratified Porous Media for the Recovery of Waterflood Residual Oil,” Sixth Petroleum Conference of the South Saskatchewan Section, the Petroleum Society of CIM, Paper No. 139, Regina, Oct. 18-19, 1995.
The authors
Shahaboddin Ayatollahi ([email protected]) is an associate professor of chemical and petroleum engineering at Shiraz University, Iran, and dean of engineering. His research interests are flow in porous media and enhanced oil recovery techniques. Ayatollahi holds a BS and an MS in chemical engineering from Shiraz University and a PhD in chemical engineering from the University of Waterloo, Canada.
Arsalan Zolfaghari ([email protected]) is an MS student of chemical engineering at Sharif University of Technology, Tehran. He has expertise in different programming languages, application software and is interested in process simulation, thermodynamics, and petroleum engineering. Zolfaghari received a BS in chemical engineering from Shiraz University.
