SEISMIC EMISSION TOMOGRAPHY-1: Seismic used to directly map reservoir permeability fields
This two-part article summarizes a series of tests indicating that a technology now exists for near real-time 3D mapping of the reservoir-scale permeability field using surface-based seismic acquisition networks.
Despite decades of work, hydrocarbon production, particularly that of oil, remains highly inefficient with often up to 60-70% of the known resource being left unproduced. It is generally acknowledged that the principal obstacle to more efficient production is the absence of a means of accurately mapping the reservoir “architecture” or permeability field.
Our work, combining a new geomechanical model for the behavior of fluids in the earth’s brittle crust in combination with a previously unexploited seismic imaging technology, seismic emission tomography (SET), is shown to allow direct imaging and mapping of the reservoir-scale permeability field geometry.
This technique could have important implications for improved efficiencies of hydrocarbon exploration and exploitation.
Why imaging is difficult
The most ubiquitous secondary rock structure is fracture.
For example, no rocks are known to be totally devoid of joints. Because fractures scale like earthquakes, i.e., there is an inverse power law relationship between size and frequency, it may be said that there is no such thing as an “unfractured” rock, at least at some scale.
So to varying degrees all reservoirs are fractured reservoirs, and fractures can be said to play an important and often critical role in the architecture of all fluid reservoirs. The relationship between fracture size and frequency indicates that because there are many orders of magnitude more smaller fractures than large ones, it is highly likely that much of the permeability resides in the smaller fractures.
Thus the ability to image the full spectrum of crack sizes would seem to be a requirement for direct permeability field mapping.
Recognizing fracture’s critical role but also recognizing that any given reservoir will have many fracture sets with a wide range of orientations for the sets, how do we identify precisely which fracture sets constitute the permeability field? A number of recent studies show that hydraulically conductive fractures are dominantly critically oriented for shear and obey Mohr Coulomb criteria suggesting that if we knew the stress field we could predict the average directions of fractures that form the permeability field.
Although statistically true at the reservoir scale, at the scale of the individual fractures there are significant exceptions to this rule thereby making it impossible to explicitly map the permeability field using only this relationship.
Another problematic aspect of reservoir permeability is that it tends to be highly heterogeneous, i.e., there are zones in which the permeability may be order of magnitudes higher than in the surrounding rocks. This phenomenon is in part responsible for the fact that in any given field a relatively small number of wells are responsible for most of the production, i.e., the ones that have hit “sweet spots.”
Most important, this phenomenon creates considerable uncertainty. Further, fracture and faults themselves are typically embedded in “process” zones in which the fracture density increase with proximity to the fracture or fault and where the relation between fracture/fault length and the width of the process zone tends to increase with the length of the fault plotting as a straight line on a log/log plot. This implies that where permeability is a function of crack density and assuming that the “process zone” does not contain other permeability-reducing processes, locating the centers of such zones should provide the highest permeability.
A final complication is that the permeability field itself is dynamic. As is well known the act of producing hydrocarbons changes, sometimes disastrously, the permeability field itself. Little is understood about the causes and time scale over which these changes occur.
Behavior of fields
The following set of empirical observations, proposed a geomechanical model for the behavior of the permeability field in response to changes in fluid pressure:1
- Rate correlation statistics: The far-field effects that production in one well may have on others, sometimes miles away, have been known for decades. These effects are known to propagate very rapidly, often within hours or even minutes. A systematic statistical analysis of these effects2 uses rate correlation statistics to show that with respect to any given injector well, wells whose production increased (a positive rate correlation) all lay within a 70° to 80° sector of arc with respect to the injector, where the arc sector is bisected by the maximum horizontal compressive stress (Shmax). Thus statistically the wells that respond positively have orientations consistent with Mohr Coulomb crack behavior. Of particular importance is that wells as much as three miles from the injector had positive correlations with essentially instantaneous response times. These observations led to an hypothesis that this behavior resulted from a wave phenomenon caused by a cascade of “inelastic failures in the fault/fracture structure of the rock propagating in ‘domino fashion.’”2 A similar analysis2 on wells known to be in fluid communication on the basis of flood directionality studies, indicates that the results are a manifestation of the permeability field.
- Critical orientation of hydraulically conductive fracture: Analysis of fluid flow in faulted rocks suggests that the bulk of fluid transport occurred on those fracture which are critically oriented under Mohr Coulomb conditions for shear.3
- The near-critical state of the earth’s crust: Over the last several decades earthquake seismologists have established that the earth’s crust is in a near-critical state, i.e., it is close to brittle failure almost everywhere, where failure is manifest principally by slip on preexisting fractures. Just how close has been established by analyzing stress drop data associated with microseismic activity. Statistical analysis of the data4 shows that small (±0.01 bar) perturbations of the ambient stress field are sufficient to cause failure of critically oriented cracks.
Because it was unclear how the crack cascade mechanism could result in the increases in fluid pressure (Pf), let alone the sustained increase in Pf required to increase production, it was suggested1 that the phenomena was the result of a fluid pressure “Pf wave” propagating through the hydraulically linked fracture network connecting the wells.
A wave of this type has been found experimentally5 and is referred to as a “slow wave.”
Combining the Pf wave hypothesis with the foregoing empirical data forms the basis of a simple geomechanical model. The model predicts that the response of the earth’s brittle crust to a change in fluid pressure should result in systematic slip and associated brittle failure of the hydraulically linked fractures connected to the point of Pf perturbation.
Acoustic energy (AE) generated by the slip events can be detected. Thus propagation of the Pf “wave” through the critically oriented fracture network forming the permeability field will produce AE emissions resulting in its “illumination.” Recording the AE emissions should allow direct mapping of the fracture-related permeability field. The following outlines this model:
- Given: The state of the earth’s brittle crust is everywhere near failure.
- A change in Pf at a well changes the stress state at the well.
- The change in Pf propagates through the hydraulically linked fracture network connected to the perturbation point changing the stress state as it moves.
- This fracture network consists of preexisting cracks critically oriented for slip that are also fluid filled and therefore the weakest fractures.
- Because stress drops on the order of ±0.01 bar are sufficient to cause failure and because changes in Pf induced by production are on the order of hundreds of bars, the Pf wave will cause failure of the critically oriented cracks forming the permeability field thereby “illuminating” it.
The problem is thus reduced to one of being able to image the AE emitted by the slip on preexisting cracks across the broadest spectrum of crack sizes possible. If this can be done in near real time and at the reservoir scale then direct mapping of the permeability field is possible.
Imaging microseismicity
Because there is a continuous spectrum of crack sizes, the distinction between microseismicity and creep is arbitrary.
Creep, for instance, is defined as the processes that allow continuous deformation and so is scale dependent. Although microseismic events are considered to be larger than creep events, a rule of thumb distinguishes them on the basis of whether or not the failure events are resolvable under ordinary field conditions.
If the event is resolvable it is considered microseismicity; if not, it is considered creep. The distinction is ambiguous as the ability to detect and resolve an individual event (microseismicity) is largely dependent on how close the event is to the receiver.
The detection of microseismic events using surface networks is severely hampered by attenuation and noise. The most robust form of microseismicity detection requires the use of downhole seismometers in the effort to place the detectors as close to the sources as possible. This is the method in general use for monitoring induced fracture stimulations. The use of downhole instruments to detect microseismicity suffers from a number of well-known drawbacks.
- It requires a dedicated well ideally within 0.5 mile of the treatment well.
- The ability to detect resolvable events drops off with the inverse square of the distance to the source. Thus the spectrum of events, already limited by the resolvability requirement, is further filtered by distance.
- Because of the inverse power law relationship between the size and number of events, there are orders of magnitude more unresolvable events than resolvable. Thus only a limited part of the crack size spectrum constituting the permeability field can be seen.
This set of problems means that it is at least highly impractical if not impossible to map the reservoir scale permeability using downhole instruments. Accomplishing this task clearly requires a different technology.
The SET technique
Seismic emission tomography emerged from the technical section of the Nuclear Test Ban treaty in the late 1980s and early 1990s.
It is geared specifically toward identifying “point” sources (meaning dimensions less than a minimum processed wavelength in scale) of energy. SET can also find a sufficiently “rough” surface, meaning a surface that behaves like a bunch of individual scatters.
Identification of a scatterer as well as point sources is done by coherence (using semblance as the metric). This requires multiple channels of on-the-ground recording.
A signal will show up only if it arrives at all the channels within a certain time window. Noise will cancel out (or at least not add together as rapidly).
To first order, the signal to noise ratio behaves as the square root of the number of channels available. The best one can do with any technique in order to determine if one is looking at signal or noise is to compute the appropriate statistics. For SET these statistics are generally simple to derive.
The product of SET is a “three dimensional image of the medium where the distribution of brightness shows the distribution of active volumes...(it is) a portrait of the medium in terms of its ability to produce or scatter seismic energy.”6
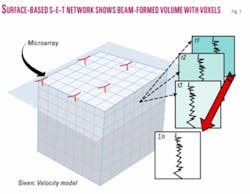
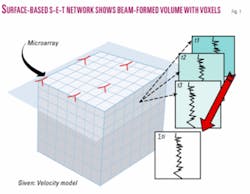
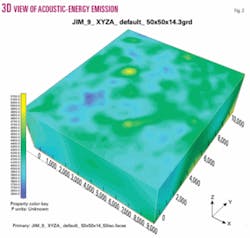
SET uses a surface-based seismic network (Fig. 1) to beam form the selected volume of the earth’s crust. For any given time interval the AE emissions for each voxel are stacked to provide a value for the AE emission at each associated grid point of the volume. The values for each voxel of the volume are then normalized against all the AE values of the volume and contoured to provide an image of the AE emission field (Fig. 2).
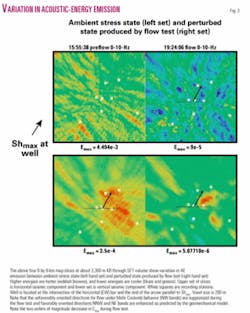
An example of a set of map slices through two SET volumes is shown in Fig. 3. The use of SET allows 1) the entire spectrum of active crack sizes to be imaged; 2) the use of a surface network for monitoring AE emissions; 3) the area covered is limited only by the size of the network deployed.
It is clear that SET has none of the limitations that the use of downhole instruments for monitoring microseismicity has; there are, however, some tradeoffs:
- SET cannot locate individual cracks but instead plots the distribution of AE emissions, where the primary emission sources are the product of crack failure.
- SET cannot currently distinguish the crack sizes generating the AE. This is because the amount of AE being emitted by any given voxel is a function of the total crack area formed in the volume for the particular stack interval, i.e., the AE can result from either many small failures or from a single large failure.
- The resolution of the AE locations is set by the voxel size, which is in turn a function of the number of receivers and the local environment. The current theoretical maximum resolution is 10 m, i.e., voxel size is 10 by 10 by 10 m, however 5-m resolution may be possible under the right set of conditions.
Next week: Results of field studies in British Columbia and the North Texas Barnett shale.
The authors
Peter Geiser ([email protected]) is president of STRM LLC. His research has focused on deformation processes of the brittle crust. He has worked in both academia (University of Connecticut) and industry (Geologic Systems, CogniSeis Development) where he developed technology that integrates structural geology and geophysics. He has a PhD in geology from Johns Hopkins University.
Jan Vermilye is a structural geologist who specializes in fault-zone deformation. She joined STRM LLC after teaching in the earth and environmental sciences department at Whittier College. Her dissertation at Lamont Doherty Earth Observatory was an investigation of fault process zones. She has a PhD in geology from Columbia University.
Robert Scammell is employed by ConocoPhillips Canada. He has broad interests currently focused on fractured gas reservoirs. He has worked for Amoco, Poco Petroleums, and Burlington. He sits on two Canadian Society of Petroleum Geologists committees and three federal science and technology committees. He has a PhD in geology from Queen’s University.
Steven Roecker is a professor of geophysics in the department of earth and environmental sciences at Rensselaer Polytechnic Institute. He received a PhD in geophysics from Massachusetts Institute of Technology and was a research scientist at MIT before joining the faculty at RPI in 1986.


