Multiproduct software sets optimal pump use
Simulation software developed by China University of Petroleum-Beijing in conjunction with China National Petroleum Corp. allows automatic determination of optimal pump use on multiproduct pipelines.
The rapid expansion of China’s economy has led to the construction of several new multiproduct pipelines in the country, with still others in the construction or design stages to meet future demand for refined products.
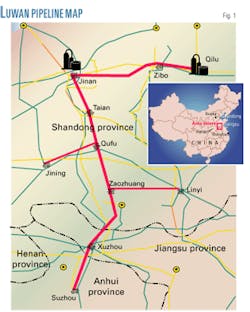
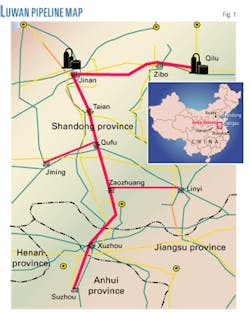
Current multiproduct pipelines include CNPC’s 587.7-km Luwan pipeline (Fig. 1).1 The pipeline originates at Qilu refinery in Shandong province, includes three stripping stations at Zibo, Tai’an, and Xuzho, one input and boosting station at Jinan, and two junctions at Qufu and Zaozhuang, before reaching its terminus at Suzhou.
It also includes two legs, measuring 69.2 and 101.2 km, extending to Jining and Linyi terminals respectively from Qufu and Zaozhuang junctions. The pipeline transports 5,850,000 tons/year of refined products from Shandong province to Jiangsu and Anhui provinces.
Software
Although the Luwan pipeline is smaller than other multiproduct pipelines in China, its branch lines-each of which requires a particular mix of products-and multiple input stations complicate the system.
Before commissioning, CNPC asked CUPB to provide simulating software that would address pipeline scheduling, safety, and efficiency.
CNPC and CUPB decided to develop two products to address these issues: scheduling simulation software (SSS) and hydraulic simulation software (HSS).
SSS allows users to make an outline schedule for 10 days to 1 month, depending on customer demand. HSS helps operators find the most efficient pumping plan to complete the schedule set by SSS. HSS also tells users how much product contamination the selected schedule will cause and if the schedule is feasible.
SSS
Almost all large multiproduct pipelines have their own algorithms and corresponding software to help with scheduling. Previous studies have addressed specified-order method, elemental-clock method, master-clock method, average-rate method, and displacement method as different frameworks for software development, with the master-clock method (evolved from the elemental-clock method) emerging as the most flexible.
This method defines times when particular activities, such as injecting, lifting, and stripping can take place at control points. Calculations proceed in sequence, and the state of the system as each calculation occurs defines the operating status of each control point. The sequence of calculations which produce the smallest time span to a control point is selected, and the entire system is updated by that time span.2 3
The method this article describes uses variable pace to accelerate the master-clock method and adds the points at which product interfaces reach stations to the variables used in simulating the operational characteristics of the Luwan pipeline and developing a new algorithm on which to base its modeling software.
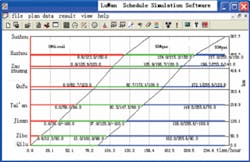
Fig. 2 shows the main interface of the software. The short, horizontal, bold lines show the stripping or inputting processes, with the time window and flow rate of stripping or inputting appearing beneath.
The assumptions of incompressible liquids, isothermal transport of products, and changeless density of products with pressure and temperature in the schedule model make it difficult to track the interface accurately. The difference between real time and simulated time typically measures 30 min, considered acceptable by current users. Recurring sampling data and data from SCADA allow the estimated position of batches to be adjusted over time.
Both SSS and HSS require data describing the pipeline profile, initial line fill, and the demand plans of stripping stations along the pipeline.
CNPC required that SSS provide:
- Batch interface strip picture and the timetable of interfaces arriving at stations.
- Stripping schedule of all products passing the station for local operators; including stripping flow rate, time window, and total volume.
- Stripping schedules of all products passing all stations for operators at the control center; including stripping flow rate, time window, and total volume.
- Ability to copy some previous schedule as the start point when making a new schedule.
- Unlimited number of batches.
- Several kinds of output format, modified to meet specific user (shippers, dispatchers, operators, etc.) needs.
- Intuitive processes, mirroring those a person would use absent the software.
HSS
After developing a schedule using SSS, schedulers have to determine that it is feasible given current pipeline capacity and constraints. HSS not only makes this determination but also chooses the appropriate pumping plan to maximize energy efficiency while minimizing shutdowns and contamination.
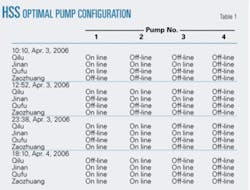
HSS provides two modes of simulating the schedule. The first automatically determines the pipeline’s optimal pump configuration for the entire simulating horizon, minimizing energy costs across the system (Table 1). This simulation, however, requires a long time to perform due to the large combination of pumps involved and may also result in numerous shutdowns and start-ups of individual pumps while optimizing the system.
The software’s second simulating engine allows users to mimic the transportation process, while manually setting pump configurations based on their practical experience. But the combination of several pump stations (with three to five pumps at each station) and changing hydraulic and material conditions make it difficult to manually combine pumps satisfactorily.
The recommended method, therefore, is to let the software produce the automatic optimal result and then manually alter the optimal pump configurations to reduce frequent startups and shutdowns.
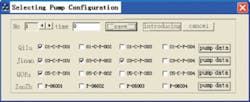
The button “Introducing” in the software’s “Selecting pumps” dialogue brings up the initial pump configuration, which users can then use to make an even better pumping plan (Fig. 3).
HSS’ optimal mathematical basis is a steady-state model. Dynamic programming theory can solve the multistage decision problem of optimal pump configuration.
Providing optimal pump configuration information is distinct to HSS. ESI Co.’s TELNET and Advantica Co.’s SPS are both popular hydraulic simulation software products, but they cannot determine the optimal pump configuration despite simulating the hydraulic process very well.
In addition to determining optimal pump configuration, HSS:
- Shows transportation processes.
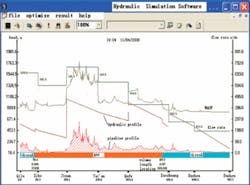
The software visually simulates the process of batch transportation. The screen displays pressures, flow rates, locations of interfaces, the topographical curve of the pipeline, and the length and volume of contamination segments in the pipeline, refreshing these variables at a time-step interval (Fig. 4). The software also replays completed simulations, making analysis of results more convenient.
- Provides simulation results.
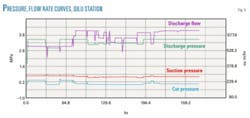
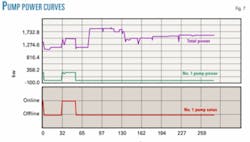
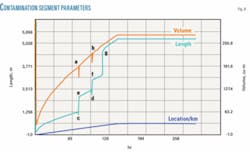
After the simulation is complete, the software provides the suction and discharge pressure and flow rate curves of all stations (Fig. 5), the batch-track strip (Fig. 6), the power curves of all pumps (Fig. 7), and any contamination information (Fig. 8).
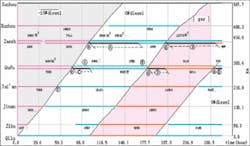
Fig. 6 shows the stripping process, flow rates, and the types of products transported at different positions and times. Diagonal lines indicate the trajectories of interfaces between two products. The lines’ slopes show the interface velocity. The short horizontal bold lines show the corresponding stripping process, including the volume stripped at each station.
Zaozhuang and Qufu stations divide the flow into two streams, one flowing into the local tank farm and the other into the stub line.
The trunk is initially filled with two different grades of diesel, and then with No. 90 gasoline and additional diesel at Jinan.
The short bars above (a,b,c,d,e...) represent the process of stripping contamination into stub lines.
The longer bars (A, B, C, D, E...) show the process of stripping pure products into stub lines to remove contamination.
Fig. 8 shows one contamination segment, including volume and length of contamination, and the position of interface. This is shown for the whole transportation process. Removing contamination at Zaozhuang and Qufu causes the sharp decrease in volume and length seen at a, b, e, and f. A change in OD results in the increase of length seen at g.
Field data collected in February 2006 during shipment of diesel validated the accuracy of HSS. Table 2 compares the field data with simulation results for the same shipment.
Acknowledgments
The author acknowledges the contributions of CNPC in preparing this article.
References
- Zeng Duoli, Deng Songsheng, and Liu Lingli, “Technology for multiproduct pipeline transportation,” Beijing: Petroleum Industry Press, 2002.
- Liang Xizhang, “Eminent Pipeline Projects in the World,” Beijing: Petroleum Industry Press, 1994; p. 287-313.
- D. Sparrow, “Implementing software systems for multi-product pipeline scheduling,” Pipes & Pipelines International, p. 14-18, August 1986.
The author
Liang Yongtu (liangyt21st@ sina.com) is an instructor and doctoral candidate at the China University of Petroleum-Beijing. He received his BS and MS degrees from CUPB in 1995 and 2001, respectively. In 2005, he spent 6 months at Robert Gordon University in Aberdeen as a visiting scholar. Liang’s area of specialty is long-distance pipeline transportation. His multiproduct pipeline simulation software and stripping scheduling software are used by several pipelines in China.
